[ad_1]
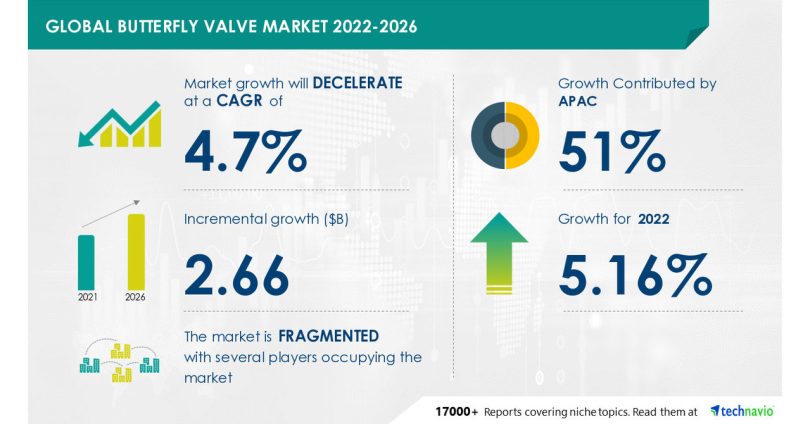
NEW YORK, Sept. 15, 2022 /PRNewswire/ — The “Butterfly Valve Market by End-user and Geography – Forecast and Analysis 2022-2026” report has been added to Technavio’s offering. According to the report, the market will observe an incremental growth of USD 2.66 billion between 2021 and 2026. However, the growth momentum is expected to decelerate at a CAGR of 4.7% during the forecast period. The report expects the market growth to be mainly driven by recent developments. In addition, factors such as growing regulatory compliance requirements for safety and carbon emissions and the increasing number of oil and gas exploration activities will positively influence the growth of the market. Download PDF Sample Report

The global butterfly valve market is fragmented due to the presence of international and regional vendors that offer different ranges of valves. Vendors compete in terms of price, brand image, quality, service, and technical expertise. However, pricing continues to be a major factor among vendors in the global butterfly valve market. There are several low-cost Asian manufacturers competing in the butterfly valve market with international vendors by offering low-cost valves.
Established players in the market are competing with other players by offering different services for a valve, such as valve diagnosis services and on-site support for valve installment, wherein vendors also provide experts and certified specialists. This helps these vendors to differentiate from other low-cost vendors. However, for established vendors, the prevalence of counterfeit and fraudulent valves is a major issue. Hence, vendors are taking several measures such as laser marking of information on valves, forming alliances to fight against these products, and educating end-users regarding authorized distributors and authentic products. Besides, some of the vendors have reached out to inorganic growth strategies to increase their market share. All these factors are expected to intensify the competition in the market over the forecast period.
The report identifies Alfa Laval Corporate AB, AVK Holding AS, Bray International, Burkert India Pvt. Ltd., Crane Co., Curtiss Wright Corp., Dembla Valves Ltd., Emerson Electric Co., Festo SE and Co. KG, Flomatic Corp., Flowserve Corp., Georg Fischer Ltd., Hobbs Valve Ltd., Honeywell International Inc., IMI Critical Engineering, KITZ Corp., KSB SE and Co. KGaA, Larsen and Toubro Ltd., Neles Corp., OHL Gutermuth Industrial Valves GmbH, Schlumberger Ltd., The Weir Group Plc, and Velan Inc. as major market participants.
Although the recent Developments will offer immense growth opportunities, fluctuations in raw material prices will challenge the growth of the market players. To make the most of the opportunities, market vendors should focus more on the growth prospects in the fast-growing segments, while maintaining their positions in the slow-growing segments. Request Sample Report Here
The global butterfly valve market is segmented as below:
- End-user
- Oil and Gas Industry
- Water and Wastewater Industry
- Power Generation Industry
- Chemical Industry
- Others
The oil and gas industry is the prime end-user in the market. The segment is driven by increasing investments in unconventional hydrocarbon exploration activities and the growing demand for clean energy.
- Geography
- APAC
- Europe
- North America
- South America
- The Middle East And Africa
APAC will emerge as the key market, occupying 51% of the global market share. The regional market is driven by the growth in several industries such as oil and gas, automotive, and chemical and petrochemical. In addition, factors such as the easy availability of raw materials and low labor and land cost are contributing to the growth of the butterfly valve market in APAC. Technavio presents a detailed picture of the market by the way of study, synthesis, and summation of data from multiple sources. Our butterfly valve market report covers the following areas:
Butterfly Valve Market 2022-2026: Vendor Analysis
We provide a detailed analysis of around 25 vendors operating in the butterfly valve market, including some of the dominant vendors. Backed with competitive intelligence and benchmarking, our research report on the butterfly valve market is designed to provide entry support, customer profile, and M&As as well as go-to-market strategy support.
Butterfly Valve Market 2022-2026: Key Highlights
- CAGR of the market during the forecast period 2022-2026
- Detailed information on factors that will assist butterfly valve market growth during the next five years
- Estimation of the butterfly valve market size and its contribution to the parent market
- Predictions on upcoming trends and changes in consumer behavior
- The growth of the butterfly valve market
- Analysis of the market’s competitive landscape and detailed information on vendors
- Comprehensive details of factors that will challenge the growth of butterfly valve market vendors
Related Reports:
|
Butterfly Valve Market Scope |
|
|
Report Coverage |
Details |
|
Page number |
120 |
|
Base year |
2021 |
|
Forecast period |
2022-2026 |
|
Growth momentum & CAGR |
Decelerate at a CAGR of 4.7% |
|
Market growth 2022-2026 |
$ 2.66 billion |
|
Market structure |
Fragmented |
|
YoY growth (%) |
5.16 |
|
Regional analysis |
APAC, Europe, North America, South America, and Middle East and Africa |
|
Performing market contribution |
APAC at 51% |
|
Key consumer countries |
US, China, India, Japan, and Germany |
|
Competitive landscape |
Leading companies, competitive strategies, consumer engagement scope |
|
Companies profiled |
Alfa Laval Corporate AB, AVK Holding AS, Bray International, Burkert India Pvt. Ltd., Crane Co., Curtiss Wright Corp., Dembla Valves Ltd., Emerson Electric Co., Festo SE and Co. KG, Flomatic Corp., Flowserve Corp., Georg Fischer Ltd., Hobbs Valve Ltd., Honeywell International Inc., IMI Critical Engineering, KITZ Corp., KSB SE and Co. KGaA, Larsen and Toubro Ltd., Neles Corp., OHL Gutermuth Industrial Valves GmbH, Schlumberger Ltd., The Weir Group Plc, and Velan Inc. |
|
Market Dynamics |
Parent market analysis, Market growth inducers and obstacles, Fast-growing and slow-growing segment analysis, COVID-19 impact and future consumer dynamics, and market condition analysis for the forecast period. |
|
Customization purview |
If our report has not included the data that you are looking for, you can reach out to our analysts and get segments customized. |
Table Of Contents:
1 Executive Summary
- 1.1 Market overview
- Exhibit 01: Executive Summary – Chart on Market Overview
- Exhibit 02: Executive Summary – Data Table on Market Overview
- Exhibit 03: Executive Summary – Chart on Global Market Characteristics
- Exhibit 04: Executive Summary – Chart on Market by Geography
- Exhibit 05: Executive Summary – Chart on Market Segmentation by End-user
- Exhibit 06: Executive Summary – Chart on Incremental Growth
- Exhibit 07: Executive Summary – Data Table on Incremental Growth
- Exhibit 08: Executive Summary – Chart on Vendor Market Positioning
2 Market Landscape
- 2.1 Market ecosystem
- Exhibit 09: Parent market
- Exhibit 10: Market Characteristics
3 Market Sizing
- 3.1 Market definition
- Exhibit 11: Offerings of vendors included in the market definition
- 3.2 Market segment analysis
- Exhibit 12: Market segments
- 3.4 Market outlook: Forecast for 2021-2026
- Exhibit 13: Chart on Global – Market size and forecast 2021-2026 ($ million)
- Exhibit 14: Data Table on Global – Market size and forecast 2021-2026 ($ million)
- Exhibit 15: Chart on Global Market: Year-over-year growth 2021-2026 (%)
- Exhibit 16: Data Table on Global Market: Year-over-year growth 2021-2026 (%)
4 Five Forces Analysis
- 4.1 Five forces summary
- Exhibit 17: Five forces analysis – Comparison between 2021 and 2026
- 4.2 Bargaining power of buyers
- Exhibit 18: Chart on Bargaining power of buyers – Impact of key factors 2021 and 2026
- 4.3 Bargaining power of suppliers
- Exhibit 19: Bargaining power of suppliers – Impact of key factors in 2021 and 2026
- 4.4 Threat of new entrants
- Exhibit 20: Threat of new entrants – Impact of key factors in 2021 and 2026
- 4.5 Threat of substitutes
- Exhibit 21: Threat of substitutes – Impact of key factors in 2021 and 2026
- 4.6 Threat of rivalry
- Exhibit 22: Threat of rivalry – Impact of key factors in 2021 and 2026
- 4.7 Market condition
- Exhibit 23: Chart on Market condition – Five forces 2021 and 2026
5 Market Segmentation by End-user
- 5.1 Market segments
- Exhibit 24: Chart on End-user – Market share 2021-2026 (%)
- Exhibit 25: Data Table on End-user – Market share 2021-2026 (%)
- 5.2 Comparison by End-user
- Exhibit 26: Chart on Comparison by End-user
- Exhibit 27: Data Table on Comparison by End-user
- 5.3 Oil and gas Industry – Market size and forecast 2021-2026
- Exhibit 28: Chart on Oil and gas Industry – Market size and forecast 2021-2026 ($ million)
- Exhibit 29: Data Table on Oil and gas Industry – Market size and forecast 2021-2026 ($ million)
- Exhibit 30: Chart on Oil and gas Industry – Year-over-year growth 2021-2026 (%)
- Exhibit 31: Data Table on Oil and gas Industry – Year-over-year growth 2021-2026 (%)
- 5.4 Water and wastewater industry – Market size and forecast 2021-2026
- Exhibit 32: Chart on Water and wastewater industry – Market size and forecast 2021-2026 ($ million)
- Exhibit 33: Data Table on Water and wastewater industry – Market size and forecast 2021-2026 ($ million)
- Exhibit 34: Chart on Water and wastewater industry – Year-over-year growth 2021-2026 (%)
- Exhibit 35: Data Table on Water and wastewater industry – Year-over-year growth 2021-2026 (%)
- 5.5 Power generation industry – Market size and forecast 2021-2026
- Exhibit 36: Chart on Power generation industry – Market size and forecast 2021-2026 ($ million)
- Exhibit 37: Data Table on Power generation industry – Market size and forecast 2021-2026 ($ million)
- Exhibit 38: Chart on Power generation industry – Year-over-year growth 2021-2026 (%)
- Exhibit 39: Data Table on Power generation industry – Year-over-year growth 2021-2026 (%)
- 5.6 Chemical industry – Market size and forecast 2021-2026
- Exhibit 40: Chart on Chemical industry – Market size and forecast 2021-2026 ($ million)
- Exhibit 41: Data Table on Chemical industry – Market size and forecast 2021-2026 ($ million)
- Exhibit 42: Chart on Chemical industry – Year-over-year growth 2021-2026 (%)
- Exhibit 43: Data Table on Chemical industry – Year-over-year growth 2021-2026 (%)
- 5.7 Others – Market size and forecast 2021-2026
- Exhibit 44: Chart on Others – Market size and forecast 2021-2026 ($ million)
- Exhibit 45: Data Table on Others – Market size and forecast 2021-2026 ($ million)
- Exhibit 46: Chart on Others – Year-over-year growth 2021-2026 (%)
- Exhibit 47: Data Table on Others – Year-over-year growth 2021-2026 (%)
- 5.8 Market opportunity by End-user
- Exhibit 48: Market opportunity by End-user ($ million)
6 Customer Landscape
- 6.1 Customer landscape overview
- Exhibit 49: Analysis of price sensitivity, lifecycle, customer purchase basket, adoption rates, and purchase criteria
7 Geographic Landscape
- 7.1 Geographic segmentation
- Exhibit 50: Chart on Market share by geography 2021-2026 (%)
- Exhibit 51: Data Table on Market share by geography 2021-2026 (%)
- 7.2 Geographic comparison
- Exhibit 52: Chart on Geographic comparison
- Exhibit 53: Data Table on Geographic comparison
- 7.3 APAC – Market size and forecast 2021-2026
- Exhibit 54: Chart on APAC – Market size and forecast 2021-2026 ($ million)
- Exhibit 55: Data Table on APAC – Market size and forecast 2021-2026 ($ million)
- Exhibit 56: Chart on APAC – Year-over-year growth 2021-2026 (%)
- Exhibit 57: Data Table on APAC – Year-over-year growth 2021-2026 (%)
- 7.4 Europe – Market size and forecast 2021-2026
- Exhibit 58: Chart on Europe – Market size and forecast 2021-2026 ($ million)
- Exhibit 59: Data Table on Europe – Market size and forecast 2021-2026 ($ million)
- Exhibit 60: Chart on Europe – Year-over-year growth 2021-2026 (%)
- Exhibit 61: Data Table on Europe – Year-over-year growth 2021-2026 (%)
- 7.5 North America – Market size and forecast 2021-2026
- Exhibit 62: Chart on North America – Market size and forecast 2021-2026 ($ million)
- Exhibit 63: Data Table on North America – Market size and forecast 2021-2026 ($ million)
- Exhibit 64: Chart on North America – Year-over-year growth 2021-2026 (%)
- Exhibit 65: Data Table on North America – Year-over-year growth 2021-2026 (%)
- 7.6 South America – Market size and forecast 2021-2026
- Exhibit 66: Chart on South America – Market size and forecast 2021-2026 ($ million)
- Exhibit 67: Data Table on South America – Market size and forecast 2021-2026 ($ million)
- Exhibit 68: Chart on South America – Year-over-year growth 2021-2026 (%)
- Exhibit 69: Data Table on South America – Year-over-year growth 2021-2026 (%)
- 7.7 Middle East and Africa – Market size and forecast 2021-2026
- Exhibit 70: Chart on Middle East and Africa – Market size and forecast 2021-2026 ($ million)
- Exhibit 71: Data Table on Middle East and Africa – Market size and forecast 2021-2026 ($ million)
- Exhibit 72: Chart on Middle East and Africa – Year-over-year growth 2021-2026 (%)
- Exhibit 73: Data Table on Middle East and Africa – Year-over-year growth 2021-2026 (%)
- 7.8 China – Market size and forecast 2021-2026
- Exhibit 74: Chart on China – Market size and forecast 2021-2026 ($ million)
- Exhibit 75: Data Table on China – Market size and forecast 2021-2026 ($ million)
- Exhibit 76: Chart on China – Year-over-year growth 2021-2026 (%)
- Exhibit 77: Data Table on China – Year-over-year growth 2021-2026 (%)
- 7.9 US – Market size and forecast 2021-2026
- Exhibit 78: Chart on US – Market size and forecast 2021-2026 ($ million)
- Exhibit 79: Data Table on US – Market size and forecast 2021-2026 ($ million)
- Exhibit 80: Chart on US – Year-over-year growth 2021-2026 (%)
- Exhibit 81: Data Table on US – Year-over-year growth 2021-2026 (%)
- 7.10 Germany – Market size and forecast 2021-2026
- Exhibit 82: Chart on Germany – Market size and forecast 2021-2026 ($ million)
- Exhibit 83: Data Table on Germany – Market size and forecast 2021-2026 ($ million)
- Exhibit 84: Chart on Germany – Year-over-year growth 2021-2026 (%)
- Exhibit 85: Data Table on Germany – Year-over-year growth 2021-2026 (%)
- 7.11 India – Market size and forecast 2021-2026
- Exhibit 86: Chart on India – Market size and forecast 2021-2026 ($ million)
- Exhibit 87: Data Table on India – Market size and forecast 2021-2026 ($ million)
- Exhibit 88: Chart on India – Year-over-year growth 2021-2026 (%)
- Exhibit 89: Data Table on India – Year-over-year growth 2021-2026 (%)
- 7.12 Japan – Market size and forecast 2021-2026
- Exhibit 90: Chart on Japan – Market size and forecast 2021-2026 ($ million)
- Exhibit 91: Data Table on Japan – Market size and forecast 2021-2026 ($ million)
- Exhibit 92: Chart on Japan – Year-over-year growth 2021-2026 (%)
- Exhibit 93: Data Table on Japan – Year-over-year growth 2021-2026 (%)
- 7.13 Market opportunity by geography
- Exhibit 94: Market opportunity by geography ($ million)
8 Drivers, Challenges, and Trends
- 8.3 Impact of drivers and challenges
- Exhibit 95: Impact of drivers and challenges in 2021 and 2026
9 Vendor Landscape
- 9.2 Vendor landscape
- Exhibit 96: Overview on Criticality of inputs and Factors of differentiation
- 9.3 Landscape disruption
- Exhibit 97: Overview on factors of disruption
- 9.4 Industry risks
- Exhibit 98: Impact of key risks on business
10 Vendor Analysis
- 10.1 Vendors covered
- Exhibit 99: Vendors covered
- 10.2 Market positioning of vendors
- Exhibit 100: Matrix on vendor position and classification
- 10.3 Alfa Laval Corporate AB
- Exhibit 101: Alfa Laval Corporate AB – Overview
- Exhibit 102: Alfa Laval Corporate AB – Business segments
- Exhibit 103: Alfa Laval Corporate AB – Key news
- Exhibit 104: Alfa Laval Corporate AB – Key offerings
- Exhibit 105: Alfa Laval Corporate AB – Segment focus
- 10.4 Crane Co.
- Exhibit 106: Crane Co. – Overview
- Exhibit 107: Crane Co. – Business segments
- Exhibit 108: Crane Co. – Key offerings
- Exhibit 109: Crane Co. – Segment focus
- 10.5 Curtiss Wright Corp.
- Exhibit 110: Curtiss Wright Corp. – Overview
- Exhibit 111: Curtiss Wright Corp. – Business segments
- Exhibit 112: Curtiss Wright Corp. – Key offerings
- Exhibit 113: Curtiss Wright Corp. – Segment focus
- 10.6 Emerson Electric Co.
- Exhibit 114: Emerson Electric Co. – Overview
- Exhibit 115: Emerson Electric Co. – Business segments
- Exhibit 116: Emerson Electric Co. – Key news
- Exhibit 117: Emerson Electric Co. – Key offerings
- Exhibit 118: Emerson Electric Co. – Segment focus
- 10.7 Flowserve Corp.
- Exhibit 119: Flowserve Corp. – Overview
- Exhibit 120: Flowserve Corp. – Business segments
- Exhibit 121: Flowserve Corp. – Key news
- Exhibit 122: Flowserve Corp. – Key offerings
- Exhibit 123: Flowserve Corp. – Segment focus
- 10.8 Honeywell International Inc.
- Exhibit 124: Honeywell International Inc. – Overview
- Exhibit 125: Honeywell International Inc. – Business segments
- Exhibit 126: Honeywell International Inc. – Key news
- Exhibit 127: Honeywell International Inc. – Key offerings
- Exhibit 128: Honeywell International Inc. – Segment focus
- 10.9 Larsen and Toubro Ltd.
- Exhibit 129: Larsen and Toubro Ltd. – Overview
- Exhibit 130: Larsen and Toubro Ltd. – Business segments
- Exhibit 131: Larsen and Toubro Ltd. – Key news
- Exhibit 132: Larsen and Toubro Ltd. – Key offerings
- Exhibit 133: Larsen and Toubro Ltd. – Segment focus
- 10.10 Schlumberger Ltd.
- Exhibit 134: Schlumberger Ltd. – Overview
- Exhibit 135: Schlumberger Ltd. – Business segments
- Exhibit 136: Schlumberger Ltd. – Key offerings
- Exhibit 137: Schlumberger Ltd. – Segment focus
- 10.11 The Weir Group Plc
- Exhibit 138: The Weir Group Plc – Overview
- Exhibit 139: The Weir Group Plc – Business segments
- Exhibit 140: The Weir Group Plc – Key news
- Exhibit 141: The Weir Group Plc – Key offerings
- Exhibit 142: The Weir Group Plc – Segment focus
- 10.12 Velan Inc.
- Exhibit 143: Velan Inc. – Overview
- Exhibit 144: Velan Inc. – Product / Service
- Exhibit 145: Velan Inc. – Key offerings
11 Appendix
- 11.2 Inclusions and exclusions checklist
- Exhibit 146: Inclusions checklist
- Exhibit 147: Exclusions checklist
- 11.3 Currency conversion rates for US$
- Exhibit 148: Currency conversion rates for US$
- 11.4 Research methodology
- Exhibit 149: Research methodology
- Exhibit 150: Validation techniques employed for market sizing
- Exhibit 151: Information sources
- 11.5 List of abbreviations
- Exhibit 152: List of abbreviations
- in manufacturing industry: Market dynamics in some major processes and discrete industries are changing drastically, and manufacturers are gradually feeling the brunt of excessive demand fluctuations. The fluctuating prices of oil and gas and metals in the global market and the shortage of a skilled workforce worldwide have directly affected the profitability of manufacturing companies. A sudden and unexpected shift in market dynamics can drastically impact manufacturing processes and investments in capital goods.
- slowdown in the automotive industry: High motorization rates in North America and Europe, the increase in tariffs on imported vehicles in the US and China, and the global economic slowdown are likely to reduce vehicle sales in the coming years. Anticipating a decline in vehicle sales, several vehicle manufacturers are halting their vehicle production. For instance, in March 2019, Ford announced the shutdown of its three vehicle-manufacturing sites in Russia. Similarly, in August 2019, Mahindra and Mahindra Ltd. stopped vehicle production at its manufacturing units in India for 8-14 days. During the same month, Maruti Suzuki announced that it had cut its vehicle production for the sixth consecutive month in 2019. In August 2019, Honda announced a halt in car production at its Argentina-based manufacturing plants. Such a slowdown in the automotive industry is expected to hamper the growth of the market during the forecast period.
About Us
Technavio is a leading global technology research and advisory company. Their research and analysis focus on emerging market trends and provides actionable insights to help businesses identify market opportunities and develop effective strategies to optimize their market positions. With over 500 specialized analysts, Technavio’s report library consists of more than 17,000 reports and counting, covering 800 technologies, spanning across 50 countries. Their client base consists of enterprises of all sizes, including more than 100 Fortune 500 companies. This growing client base relies on Technavio’s comprehensive coverage, extensive research, and actionable market insights to identify opportunities in existing and potential markets and assess their competitive positions within changing market scenarios.
Contact
Technavio Research
Jesse Maida
Media & Marketing Executive
US: +1 844 364 1100
UK: +44 203 893 3200
Email: [email protected]
Website: www.technavio.com/
SOURCE Technavio

[ad_2]
Source link


