[ad_1]
Statistical analyses of the obtained results
In the experimental program, only three variables were varied: age (7, 28 and 90 days), curing conditions (air cured, humid-air cured, and water cured) and water to cement ratio (0.5, 0.56, 0.63, and 0.71) as an expression of the decreasing amount of cement and increasing amount of granite powder. Thus, because the compression tests were performed on 2 halves after the tensile strength tests, the overall number of investigated samples was 216. In Fig. 3, the results of the compressive strength are presented with respect to age, curing conditions, and water-to-cement ratio.
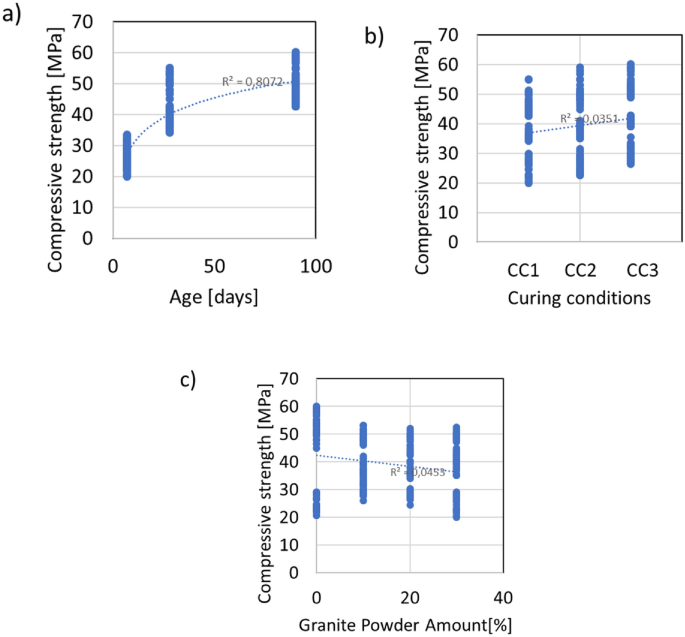
The relations between the compressive strength and (a) age, (b) curing conditions and (c) granite powder amount.
According to Fig. 3, there is only a correlation between age and compressive strength. This is supported by the value of the coefficient of determination, which is equal to R2 = 0.807. For the other variables and the compressive strength, there is a lack of correlation, as evidenced by the very low values of the coefficient of determination, which are less than R2 = 0.4. As expected, the highest compressive strength values are obtained for the samples that were kept in water; their curing conditions are denoted as CC1. The older the samples are, the higher the value of the compressive strength obtained. However, the addition of the granite powder is unable to obtain compressive strength values equal to the 60 MPa of the reference sample, but due to the filling effect of the powder, the minimum values of compressive strength increase with increasing granite powder content (from approximately 20 MPa to 28 MPa for 10% replacement of cement by granite powder and to 25 MPa for 20% replacement of cement by granite powder). This effect is very promising for the design of low-quality cementitious composite mixtures.
Modelling the compressive strength by means of ensemble models
As mentioned above, there are no strong correlation between the variables that are components of the mixture proportions, curing conditions, or testing age and compressive strength. Thus, it is reasonable to perform numerical analyses using more sophisticated techniques, e.g., ensemble models.
These models based on decision trees, which are considered supervised machine learning algorithms, are able to solve both regression and classification problems. The structure of such a decision tree consists of nodes in which a binary decision is made, and this division continues until the moment the algorithm is not able to separate the data in the node33. This node, called the leaf of the tree, provides the solution of the problem. The advantage of using this type of algorithm is the simplicity of the model obtained. However, in contrast, this is also a disadvantage because it might lead to algorithm overfitting. Decision trees are accurate and perform well on datasets with large variations in variables and when the number of records is not large34.
This problem might be solved by using a random forest algorithm, which uses many decision trees to obtain the solution to one problem. Each tree in the forest is built by a random training set, and at each node, division is carried out based on input variables that are randomly selected35.
However, in some cases, the performance of the random forest algorithm is not accurate, and efforts to improve it should be made. For this purpose, of the various ensemble learning algorithms, the adaptive boosting (AdaBoost) algorithm is the most typical and widely used36. This algorithm is effective because the next tree in the algorithm is modified based on the precision of the previous tree, strengthening the learning ability. The structural scheme of a decision tree, where the input variables are denoted Xi and the output variable is denoted Yi, is presented in Fig. 4 combined with the random forest and AdaBoost algorithm schemes.
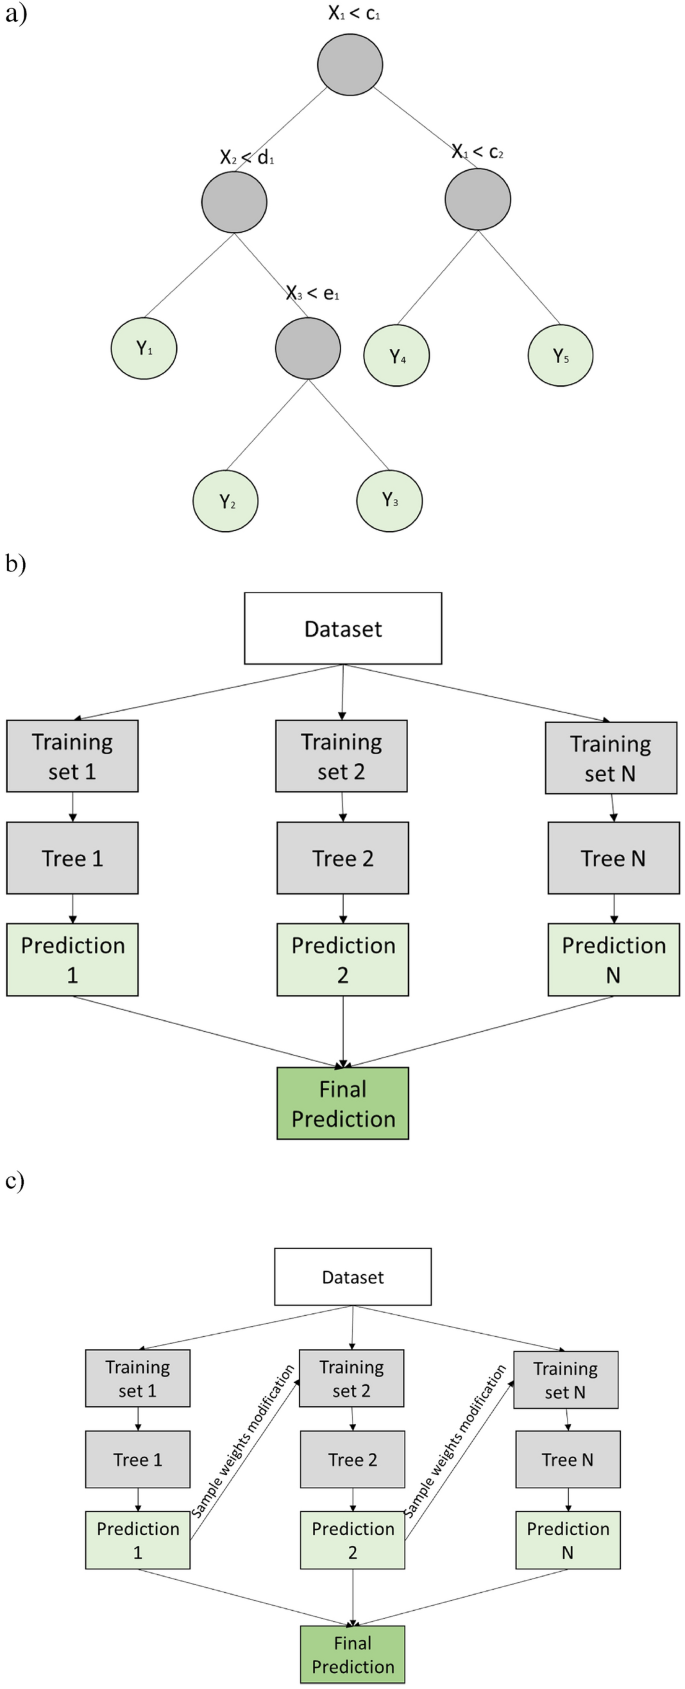
Schemes of ensemble models: (a) decision tree, (b) random forest and (c) AdaBoost.
The level of precision of the models is evaluated using a few parameters, which, according to37, can include the linear correlation coefficient (R), mean absolute error (MAE), root mean squared error (RMSE), and mean average percentage error (MAPE). The calculations of these parameters are performed as follows:
$$ R = sqrt {1 – frac{{sum left( {y – hat{y}} right)^{2} }}{{sum left( {y – overline{y}} right)^{2} }}} $$
(1)
$$ MAE = frac{1}{n}sum left| {y – hat{y}} right| $$
(2)
$$ RMSE = sqrt {frac{{sum left( {y – hat{y}} right)^{2} }}{n}} $$
(3)
$$ MAPE = frac{1}{n}sum left| {frac{{y – hat{y}}}{y}} right| cdot 100 $$
(4)
where y, measured value from the experimental test; (hat{y}), predicted value from the analyses; (overline{y}), mean value; n, number of data samples in the process.
Note that an R value closer to 1 corresponds to a better prediction from the algorithm. In turn, lower values of MAE and RMSE and MAPE mean that the algorithm predicts the output variables better than the other algorithms. Additionally, to avoid overfitting, tenfold cross-validation is performed according to38, as presented in Fig. 5.
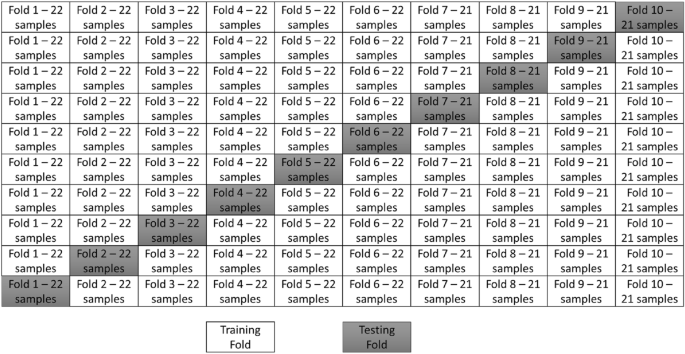
The division of the cross-validation folds.
Based on the division of the dataset presented in Fig. 5, numerical analysis is performed. The performance of each fold is evaluated and presented in Fig. 6 in terms of the values of R, MAE, RMSE and MAPE. Moreover, the relations between the experimentally measured compressive strength value and those obtained using machine learning algorithms are presented in Fig. 7, combined with the error distribution in Fig. 8.
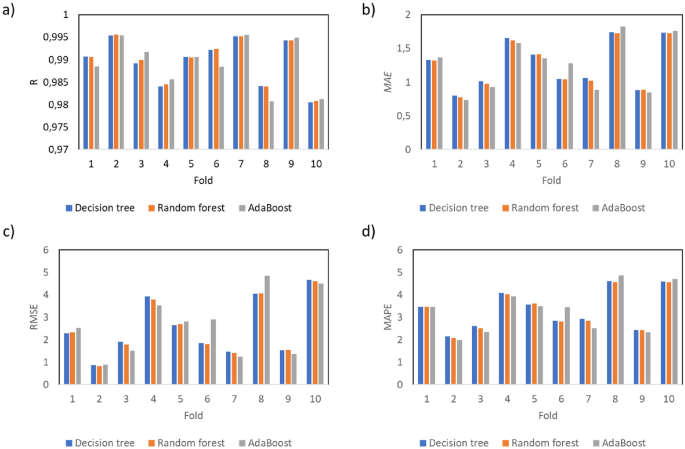
The performance of the analyses evaluated by (a) the linear coefficient of correlation, (b) mean average error, (c) root mean square error and (d) mean average percentage error.
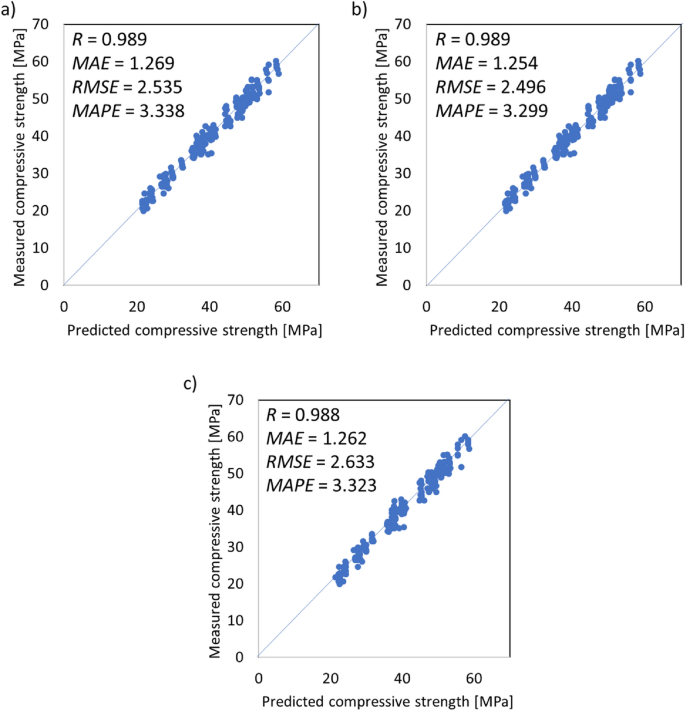
The relations between the measured compressive strength and predicted compressive strength by (a) decision tree, (b) random forest and (c) AdaBoost algorithms.
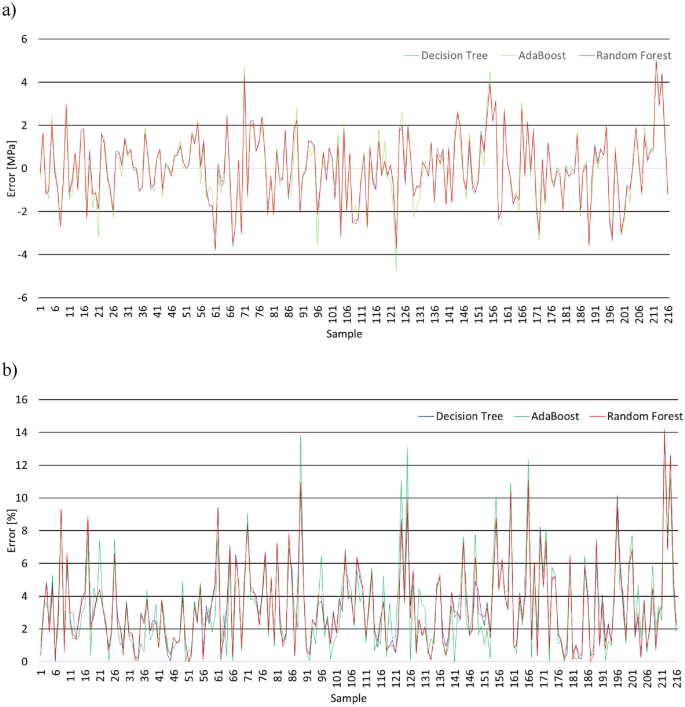
Prediction error distribution: (a) values and (b) percentage.
According to Figs. 6, 7 and 8, all of the investigated ensemble models are significantly precise in terms of predicting the compressive strength of mortar containing waste granite. This is evidenced by the very high values obtained for the linear correlation of coefficient R, which are close to 1.0. The accuracy of the performance is also supported by the very low errors values, which, as shown in Fig. 7, are less than 4%. Additionally, according to Fig. 8, the proposed models accurately predict the compressive strength values and only fail to properly predict the strength of a few samples (the percentage error is higher than 10%).
The proposed model is also accurate compared to other machine learning algorithms used for the purpose of predicting the compressive strength of green cementitious composites containing different admixtures. Some selected works are presented in Table 4 in addition to the results obtained by the models presented in this work.
Analysis of the results in Table 4 shows that the levels of precision for the compressive strength of green cementitious composites using machine learning algorithms are very high. Additionally, in this work, a very precise model for predicting the compressive strength of green cementitious composite containing different admixtures, in comparison to those investigated previously, is constructed.
[ad_2]
Source link


