
[ad_1]
This is just freaking nuts. It explains the record trade deficits, bottlenecks, shortages, and inflation pressures, among other distortions.
By Wolf Richter for WOLF STREET.
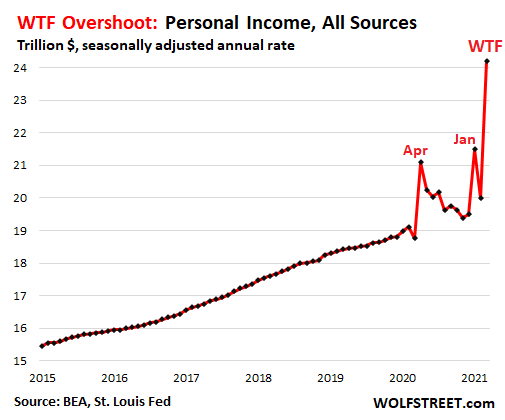
Personal income from all sources, including the free-money-from-the-sky $1,400 stimmies, spiked by 21% in March from February, and by 31% from March 2019, to a seasonally adjusted annual rate of $24.2 trillion, a historic WTF moment that shows the effects of the historic WTF overshoot triggered by the last round of stimulus payments.
A month ago, after personal income in February had plunged, following the January spike triggered by the $600 stimmies that started going out at the end of December, I said: “We’re awaiting with feverish anticipation what this chart will look like for March and April, when the $1,400-stimmies arrive. It’s going to blow our socks off.”
Hahaha, sure did. This is just freaking nuts. So here I present you the latest and greatest WTF chart of the year:
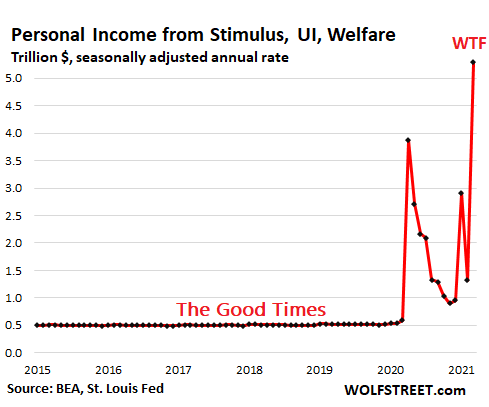
Income from stimmies, unemployment insurance, and welfare benefits exploded, driven by the stimmies that arrived in the personal treasuries of millions of households in March, according to data released by the Bureau of Economic Analysis today. Unemployment compensation ticked up a smidgen in March from February, but was lower than in January, and at an annual rate of $541 billion, was just 10% of the total:
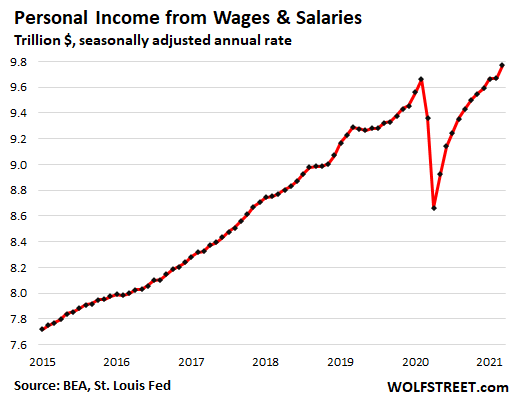
Income from wages and salaries in March rose 1.1% from February, to a seasonally adjusted annual rate of $9.8 trillion. More workers in the hospitality industry, including restaurants and hotels, were hired back. And some pay increases including higher minimum wages at state and local levels flowed into the data.
A year ago, higher-wage earners that worked in offices kept their jobs but switched to working from home. And at the high end, especially among executives, there have been lots of increases in pay packages. Job losses were concentrated at the lower end of the income scale, particularly in the hospitality and travel industry. This lower end has been hiring back some of the workers:
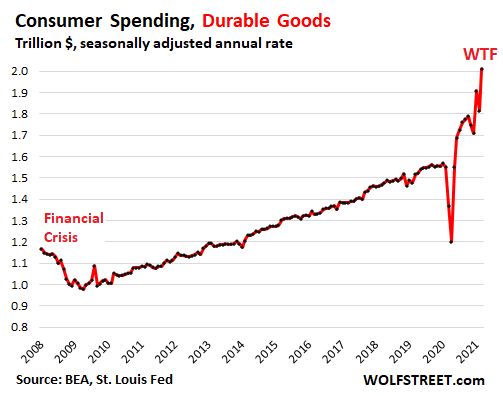
Folks spent some of the free-money-from-the-sky stimmies.
Spending on durable goods spiked by 10.8% in March from February, to a seasonally adjusted annual rate of $2.0 trillion, up 33% from March 2019.
A month ago, when February durable goods fell after the $600 stimmies got spent in January, I said, “So now everyone is counting on the big-fat new stimmies to turn this fiasco around.” And they did, for another WTF moment:
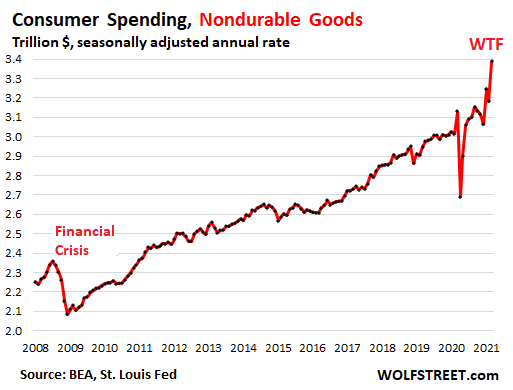
Spending on nondurable goods – mostly food and gasoline – jumped by 6.5% in March from February, to $3.4 trillion (seasonally adjusted annual rate), up 15% from March 2019:
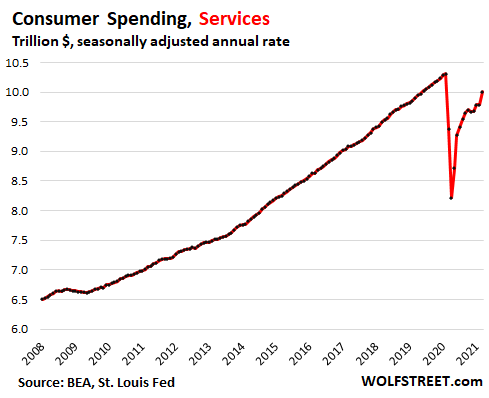
Spending on services, which had gone nowhere for six months, rose 2.2% in March from February, to $10.0 trillion (seasonally adjusted annual rate), but was still down 2.9% from the peak in February 2020.
Services include rents, mortgage interest payments, health care, education, insurance, travel bookings, subscriptions for cellphone, broadband, and streaming services, electric utility services, haircuts, ballgames, movie theater tickets, gym memberships, etc. For services the Pandemic has been a very mixed bag, with a few services, such as streaming services, killing it; and many other services, such as gyms and travel bookings, getting crushed.
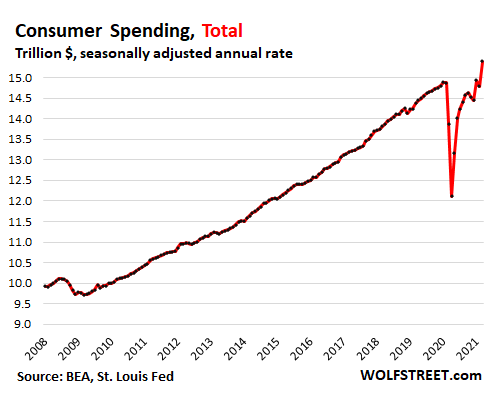
Total consumer spending – nurtured so beautifully by this free money from the sky – jumped 4.2% in March from February, and by 7.2% from March 2019, to a seasonally adjusted annual rate of $15.4 trillion:
Inflation galore but not included.
Inflation has been surging in recent months, and this has cropped up everywhere at all levels of the economy, as companies are facing skyrocketing input costs and are having to raise their prices to try to protect their margins, and as their customers – other companies and consumers – are paying those higher prices.
In the first quarter, this has shown up in the GDP data release yesterday, where the inflation index used to adjust GDP to inflation jumped by 3.8% annualized in Q1, more than double the rate in Q4, showing the extent to which inflation has accelerated. So part of the increase in spending displayed here in all its glory comes from big price increases.
The whole stimulus thing explains the record blowout trade deficits since a lot of these goods are imported, the bottlenecks, numerous shortages, the blowout freight spending, and the massive inflation pressures building up along the way, among other distortions.
Enjoy reading WOLF STREET and want to support it? Using ad blockers – I totally get why – but want to support the site? You can donate. I appreciate it immensely. Click on the beer and iced-tea mug to find out how:

Would you like to be notified via email when WOLF STREET publishes a new article? Sign up here.
![]()
Check out these great roofing options for homes and other buildings, including multifamily, at Classic Metal Roofing Systems
[ad_2]
Source link


