
[ad_1]
Orient Cement’s (NSE:ORIENTCEM) stock is up by a considerable 13% over the past week. We wonder if and what role the company’s financials play in that price change as a company’s long-term fundamentals usually dictate market outcomes. In this article, we decided to focus on Orient Cement’s ROE.
ROE or return on equity is a useful tool to assess how effectively a company can generate returns on the investment it received from its shareholders. In simpler terms, it measures the profitability of a company in relation to shareholder’s equity.
See our latest analysis for Orient Cement
How Do You Calculate Return On Equity?
Return on equity can be calculated by using the formula:
Return on Equity = Net Profit (from continuing operations) ÷ Shareholders’ Equity
So, based on the above formula, the ROE for Orient Cement is:
9.5% = ₹1.4b ÷ ₹15b (Based on the trailing twelve months to September 2022).
The ‘return’ is the amount earned after tax over the last twelve months. Another way to think of that is that for every ₹1 worth of equity, the company was able to earn ₹0.10 in profit.
Why Is ROE Important For Earnings Growth?
So far, we’ve learned that ROE is a measure of a company’s profitability. Based on how much of its profits the company chooses to reinvest or “retain”, we are then able to evaluate a company’s future ability to generate profits. Assuming everything else remains unchanged, the higher the ROE and profit retention, the higher the growth rate of a company compared to companies that don’t necessarily bear these characteristics.
Orient Cement’s Earnings Growth And 9.5% ROE
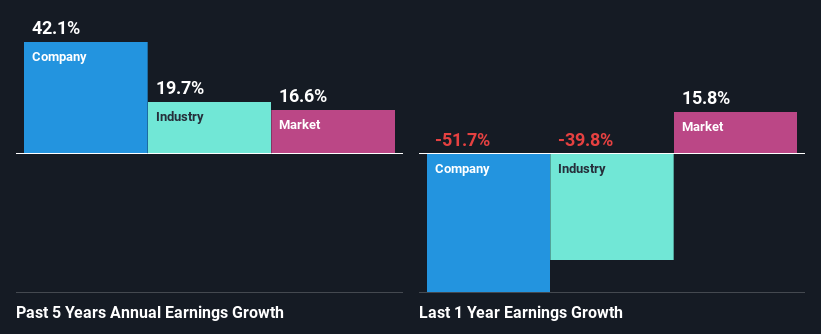
At first glance, Orient Cement’s ROE doesn’t look very promising. However, its ROE is similar to the industry average of 8.2%, so we won’t completely dismiss the company. Particularly, the exceptional 42% net income growth seen by Orient Cement over the past five years is pretty remarkable. Given the slightly low ROE, it is likely that there could be some other aspects that are driving this growth. Such as – high earnings retention or an efficient management in place.
Next, on comparing with the industry net income growth, we found that Orient Cement’s growth is quite high when compared to the industry average growth of 20% in the same period, which is great to see.
Earnings growth is an important metric to consider when valuing a stock. The investor should try to establish if the expected growth or decline in earnings, whichever the case may be, is priced in. By doing so, they will have an idea if the stock is headed into clear blue waters or if swampy waters await. If you’re wondering about Orient Cement’s’s valuation, check out this gauge of its price-to-earnings ratio, as compared to its industry.
Is Orient Cement Using Its Retained Earnings Effectively?
Orient Cement’s three-year median payout ratio to shareholders is 18%, which is quite low. This implies that the company is retaining 82% of its profits. So it looks like Orient Cement is reinvesting profits heavily to grow its business, which shows in its earnings growth.
Moreover, Orient Cement is determined to keep sharing its profits with shareholders which we infer from its long history of nine years of paying a dividend.
Summary
In total, it does look like Orient Cement has some positive aspects to its business. With a high rate of reinvestment, albeit at a low ROE, the company has managed to see a considerable growth in its earnings. While we won’t completely dismiss the company, what we would do, is try to ascertain how risky the business is to make a more informed decision around the company. To know the 2 risks we have identified for Orient Cement visit our risks dashboard for free.
Valuation is complex, but we’re helping make it simple.
Find out whether Orient Cement is potentially over or undervalued by checking out our comprehensive analysis, which includes fair value estimates, risks and warnings, dividends, insider transactions and financial health.
View the Free Analysis
Have feedback on this article? Concerned about the content? Get in touch with us directly. Alternatively, email editorial-team (at) simplywallst.com.
This article by Simply Wall St is general in nature. We provide commentary based on historical data and analyst forecasts only using an unbiased methodology and our articles are not intended to be financial advice. It does not constitute a recommendation to buy or sell any stock, and does not take account of your objectives, or your financial situation. We aim to bring you long-term focused analysis driven by fundamental data. Note that our analysis may not factor in the latest price-sensitive company announcements or qualitative material. Simply Wall St has no position in any stocks mentioned.
[ad_2]
Source link


