[ad_1]
Some say volatility, rather than debt, is the best way to think about risk as an investor, but Warren Buffett famously said that ‘Volatility is far from synonymous with risk.’ When we think about how risky a company is, we always like to look at its use of debt, since debt overload can lead to ruin. As with many other companies Trisul S.A. (BVMF:TRIS3) makes use of debt. But should shareholders be worried about its use of debt?
What Risk Does Debt Bring?
Debt assists a business until the business has trouble paying it off, either with new capital or with free cash flow. If things get really bad, the lenders can take control of the business. However, a more common (but still painful) scenario is that it has to raise new equity capital at a low price, thus permanently diluting shareholders. By replacing dilution, though, debt can be an extremely good tool for businesses that need capital to invest in growth at high rates of return. When we think about a company’s use of debt, we first look at cash and debt together.
Check out our latest analysis for Trisul
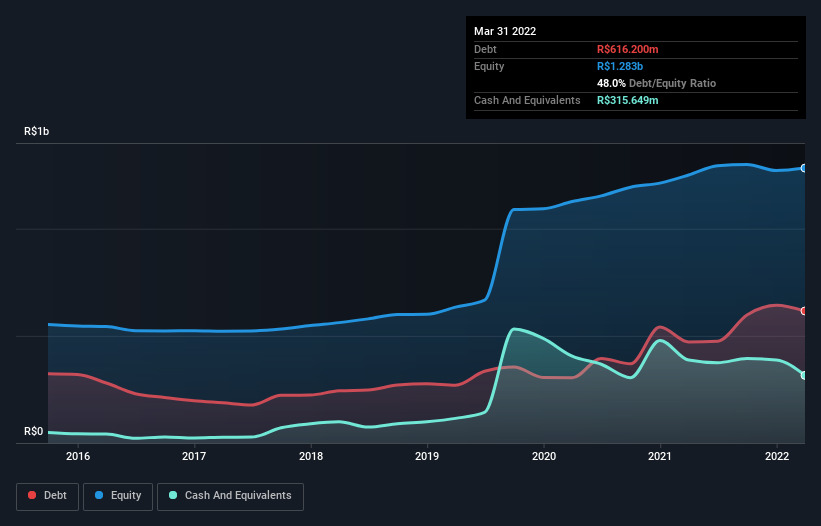
What Is Trisul’s Net Debt?
The image below, which you can click on for greater detail, shows that at March 2022 Trisul had debt of R$616.2m, up from R$471.3m in one year. However, it does have R$315.6m in cash offsetting this, leading to net debt of about R$300.6m.
A Look At Trisul’s Liabilities
We can see from the most recent balance sheet that Trisul had liabilities of R$446.3m falling due within a year, and liabilities of R$563.4m due beyond that. Offsetting these obligations, it had cash of R$315.6m as well as receivables valued at R$327.4m due within 12 months. So its liabilities outweigh the sum of its cash and (near-term) receivables by R$366.7m.
While this might seem like a lot, it is not so bad since Trisul has a market capitalization of R$734.5m, and so it could probably strengthen its balance sheet by raising capital if it needed to. However, it is still worthwhile taking a close look at its ability to pay off debt.
We use two main ratios to inform us about debt levels relative to earnings. The first is net debt divided by earnings before interest, tax, depreciation, and amortization (EBITDA), while the second is how many times its earnings before interest and tax (EBIT) covers its interest expense (or its interest cover, for short). This way, we consider both the absolute quantum of the debt, as well as the interest rates paid on it.
We’d say that Trisul’s moderate net debt to EBITDA ratio ( being 2.1), indicates prudence when it comes to debt. And its commanding EBIT of 11.0 times its interest expense, implies the debt load is as light as a peacock feather. Importantly, Trisul’s EBIT fell a jaw-dropping 33% in the last twelve months. If that decline continues then paying off debt will be harder than selling foie gras at a vegan convention. The balance sheet is clearly the area to focus on when you are analysing debt. But ultimately the future profitability of the business will decide if Trisul can strengthen its balance sheet over time. So if you want to see what the professionals think, you might find this free report on analyst profit forecasts to be interesting.
Finally, while the tax-man may adore accounting profits, lenders only accept cold hard cash. So we clearly need to look at whether that EBIT is leading to corresponding free cash flow. Over the last three years, Trisul saw substantial negative free cash flow, in total. While investors are no doubt expecting a reversal of that situation in due course, it clearly does mean its use of debt is more risky.
Our View
On the face of it, Trisul’s conversion of EBIT to free cash flow left us tentative about the stock, and its EBIT growth rate was no more enticing than the one empty restaurant on the busiest night of the year. But at least it’s pretty decent at covering its interest expense with its EBIT; that’s encouraging. Looking at the bigger picture, it seems clear to us that Trisul’s use of debt is creating risks for the company. If everything goes well that may pay off but the downside of this debt is a greater risk of permanent losses. There’s no doubt that we learn most about debt from the balance sheet. However, not all investment risk resides within the balance sheet – far from it. For example, we’ve discovered 2 warning signs for Trisul that you should be aware of before investing here.
At the end of the day, it’s often better to focus on companies that are free from net debt. You can access our special list of such companies (all with a track record of profit growth). It’s free.
Have feedback on this article? Concerned about the content? Get in touch with us directly. Alternatively, email editorial-team (at) simplywallst.com.
This article by Simply Wall St is general in nature. We provide commentary based on historical data and analyst forecasts only using an unbiased methodology and our articles are not intended to be financial advice. It does not constitute a recommendation to buy or sell any stock, and does not take account of your objectives, or your financial situation. We aim to bring you long-term focused analysis driven by fundamental data. Note that our analysis may not factor in the latest price-sensitive company announcements or qualitative material. Simply Wall St has no position in any stocks mentioned.
[ad_2]
Source link


