
[ad_1]
SolStock
Leggett & Platt (NYSE:LEG) has been around since the 1880s rewarding shareholders along the way. L&P designs and manufactures a wide variety of home furnishings including bedding, furniture, flooring, and textiles.
L&P also has a wider diversification on end markets than one would expect. With ~60% of Q1 sales coming from consumer durables, 20% from commercial/industrial clients, and the remaining 20% from the automotive market.
LEG May 2022 Company Update (LEG May 2022 Company Update)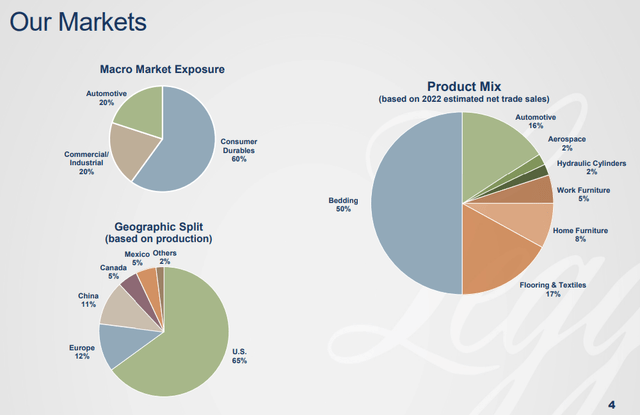
L&P has transformed itself over time from its humble beginnings for an improved bedspring. L&P now offers a wide array of products and surprisingly enough has their wares in ~80% of automobiles manufactured in North America and Europe.
LEG May 2022 Company Update Segments (LEG May 2022 Company Update Segments)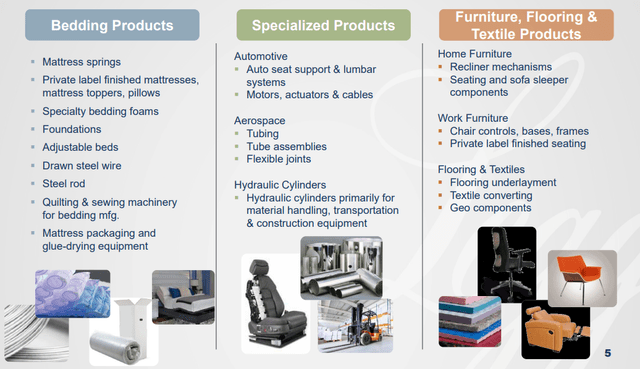
L&P is targeting 6-9% annual revenue growth through organic growth as well as acquisitions. That would be a marked increase from the prior decade that saw sales climb only 3.5% annually.
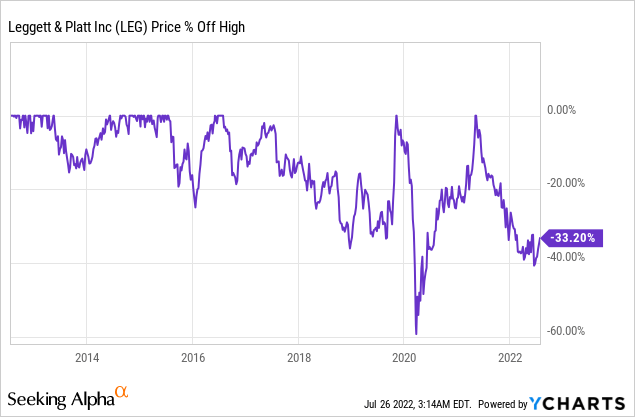
With L&P’s share price continuing to struggle, currently 33% off its high from mid-2021, I felt it was time to re-examine this Dividend King.
Dividend History
A lengthy dividend growth history is one of the quickest screens in finding a business that has performed well over time. It’s a sign that the business has some kind of staying power and has been able to weather economic storms in the past.
Leggett & Platt Dividend History (LEG Investor Relations)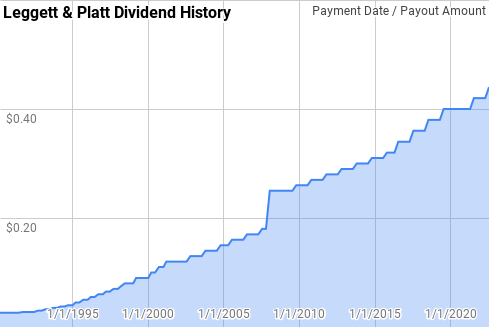
L&P’s dividend history shows a nice and steady rise over time. According to the CCC list, L&P is a Dividend King with 51 consecutive years of dividend growth. While L&P has been there very year to give dividend increases, the rate of the raises has seen pretty large fluctuations.
Since 1990, L&P’s year over year dividend growth has ranged from 1.3% to 28.2% with an average of 9.5% but a median of 6.4%.
Over that same time there’s been 27 rolling 5-year periods with annualized dividend growth spanning 3.4% to 18.6% with an average and median of 10.0%.
There’s also been 22 rolling 10-year periods with L&P’s annualized dividend growth coming in between 4.1% to 16.1% with an average of 9.8% and a median of 9.2%.
The rolling 1-, 3-, 5-, and 10-year rolling dividend growth rates from L&P since 1990 can be found the following table.
| Year | Annual Dividend | 1 Year | 3 Year | 5 Year | 10 Year |
| 1990 | $0.105 | ||||
| 1991 | $0.108 | 2.38% | |||
| 1992 | $0.115 | 6.98% | |||
| 1993 | $0.135 | 17.39% | 8.74% | ||
| 1994 | $0.155 | 14.81% | 12.97% | ||
| 1995 | $0.190 | 22.58% | 18.22% | 12.59% | |
| 1996 | $0.230 | 21.05% | 19.43% | 16.43% | |
| 1997 | $0.270 | 17.39% | 20.32% | 18.61% | |
| 1998 | $0.315 | 16.67% | 18.35% | 18.47% | |
| 1999 | $0.360 | 14.29% | 16.11% | 18.36% | |
| 2000 | $0.420 | 16.67% | 15.87% | 17.19% | 14.87% |
| 2001 | $0.480 | 14.29% | 15.07% | 15.85% | 16.14% |
| 2002 | $0.500 | 4.17% | 11.57% | 13.12% | 15.83% |
| 2003 | $0.540 | 8.00% | 8.74% | 11.38% | 14.87% |
| 2004 | $0.580 | 7.41% | 6.51% | 10.01% | 14.11% |
| 2005 | $0.630 | 8.62% | 8.01% | 8.45% | 12.73% |
| 2006 | $0.670 | 6.35% | 7.46% | 6.90% | 11.28% |
| 2007 | $0.780 | 16.42% | 10.38% | 9.30% | 11.19% |
| 2008 | $1.000 | 28.21% | 16.65% | 13.12% | 12.25% |
| 2009 | $1.020 | 2.00% | 15.04% | 11.95% | 10.98% |
| 2010 | $1.060 | 3.92% | 10.77% | 10.97% | 9.70% |
| 2011 | $1.100 | 3.77% | 3.23% | 10.42% | 8.65% |
| 2012 | $1.140 | 3.64% | 3.78% | 7.89% | 8.59% |
| 2013 | $1.180 | 3.51% | 3.64% | 3.37% | 8.13% |
| 2014 | $1.220 | 3.39% | 3.51% | 3.65% | 7.72% |
| 2015 | $1.260 | 3.28% | 3.39% | 3.52% | 7.18% |
| 2016 | $1.340 | 6.35% | 4.33% | 4.03% | 7.18% |
| 2017 | $1.420 | 5.97% | 5.19% | 4.49% | 6.17% |
| 2018 | $1.500 | 5.63% | 5.98% | 4.92% | 4.14% |
| 2019 | $1.580 | 5.33% | 5.65% | 5.31% | 4.47% |
| 2020 | $1.600 | 1.27% | 4.06% | 4.89% | 4.20% |
| 2021 | $1.660 | 3.75% | 3.44% | 4.38% | 4.20% |
Source: Author; Data Source: Leggett & Platt Investor Relations
For dividend growth investors the payout ratio is a vital metric to track. The payout ratio, whether based on net income or free cash flow, gives insight into how safe the dividend is as well as how variable the underlying business might be.
LEG Dividend Payout Ratios (LEG SEC filings)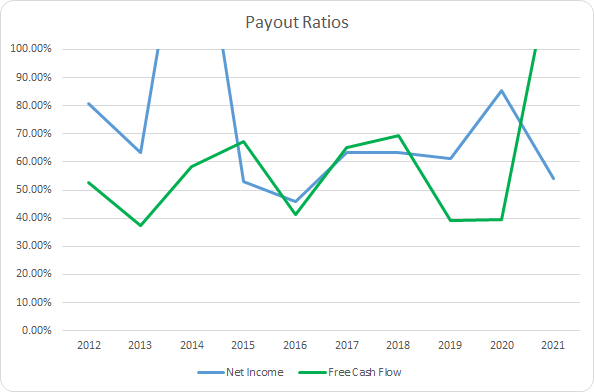
L&P’s payout ratios have seen some pretty large fluctuations; however, the dividend has typically been well covered by earnings and free cash flow. The 10-year average net income payout ratio is 74% with the 5-year average at 66%. Meanwhile the average free cash flow payout ratios are 60% and 69%, respectively.
Quantitative Quality
Of course there’s many more financial metrics that I track about a company than just its dividend growth history. I want to see how the business has grown over time as well as its profitability and capital efficiency. I’ll now explore a variety of L&P’s financial metrics from the last decade to try and get comfortable with the quality, and potential, of the business.
LEG Revenue Profits and Cash Flow (LEG SEC filings)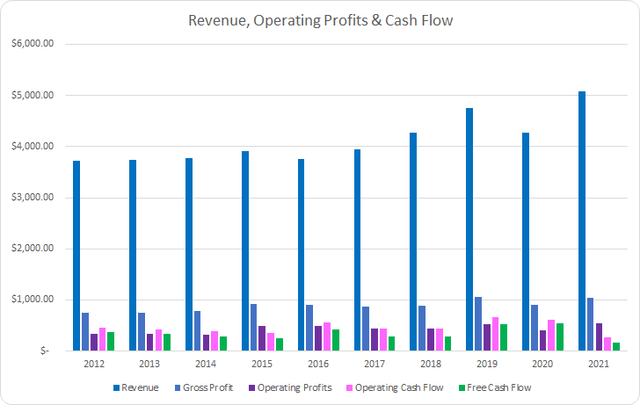
L&P’s revenues have shown modest growth during the last decade aided by several acquisitions. Over that time revenues have increased 36.3% or 3.5% annually. Gross profits rose 38.8% or 3.7% annualized during that time.
Operating profits showed pretty substantial outperformance rising 60.5% in total or 5.4% annualized. Meanwhile, operating cash flow declined by 39.7% or 5.5% annually due a substantial increase in inventories during FY 2021. Similarly, free cash flow declined 56.5% in total or 8.8% annualized for due to the drop in operating cash flow. Between FY 2012 and FY 2020, L&P’s annualized growth in operating and free cash flow were 3.7% and 4.5%, respectively.
My expectation is that good businesses with some defensible quality will be able to show stable and preferably rising margins over time. I typically want to see free cash flow margins north of 10%.
LEG Margins and CCR (LEG SEC filings)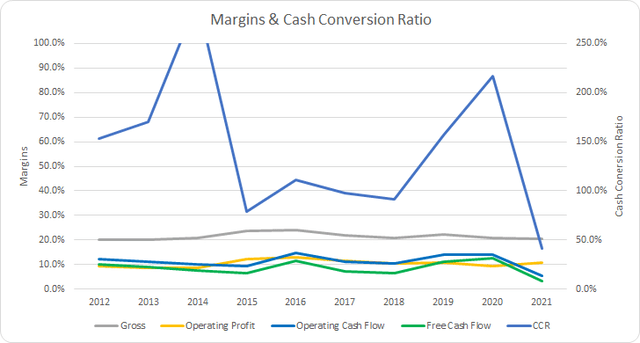
L&P’s gross margins aren’t that strong coming in with a 10-year average of 21.5% and a 5-year average of 21.3%. However, they’ve been very stable over time. L&P’s free cash flow margins have seen pretty significant swings ranging from just 3.2% up to 12.5% over the last decade. The 10-year average is 8.5% with the 5-year average at 8.1%.
Additionally I want to see high free cash flow returns compared to the assets or invested capital of the business. Similar to the free cash flow margins, I want to see stable or improving free cash flow returns on invested capital, FCF ROIC, over time.
LEG Free Cash Flow Returns (LEG SEC filings)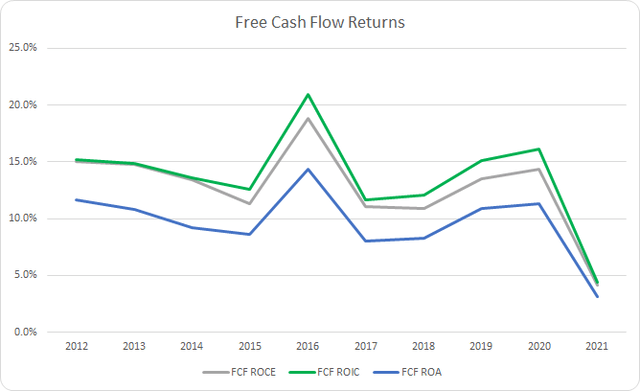
L&P’s free cash flow returns have fared better than their margins; however, the general trend doesn’t look that good. The 10-year average FCF ROA for L&P is 9.6% with the 5-year average at 8.3%. Meanwhile the average FCF ROCE’s are better at 12.7% and 10.8% with the FCF ROIC’s at 13.7% and 11.9%. Outside of FY 2021, L&P’s FCF ROICs have been greater than 10% each year.
To understand how L&P uses its free cash flow I calculate three variations of the metric, defined below:
- Free Cash Flow, FCF: Operating cash flow less capital expenditures
- Free Cash Flow after Dividend, FCFaD: FCF less total cash dividend payments
- Free Cash Flow after Dividend and Buybacks, FCFaDB: FCFaD less net cash used on share repurchases
LEG Free Cash Flows (LEG SEC filings)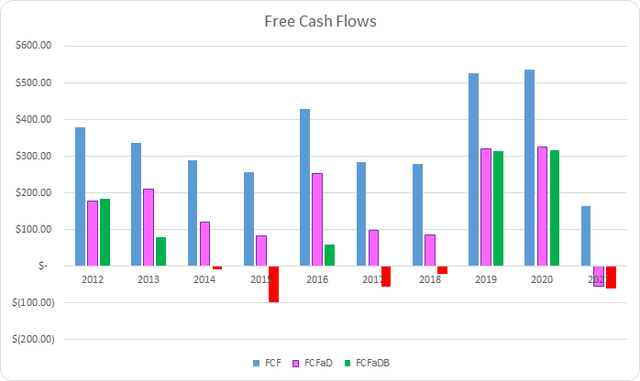
As a consumer discretionary company, it shouldn’t be much of a surprise to see L&P’s FCF vary from year to year. Over the last decade they have generated a total FCF of $3.5 B and sent $1.9 B back to shareholders via dividend payments. That brings the cumulative FCFaD to $1.6 B. L&P also used a net total of $0.9 B to repurchase shares over that time which puts the cumulative FCFaDB at $0.7 B.
While I would prefer to see more companies employ special dividends, I realize that most are incentivized to repurchase shares. Share buybacks, when done at reasonable or cheap valuations, can be a great way for a business to juice the per share value of the business.
LEG Shares Outstanding (LEG SEC filings)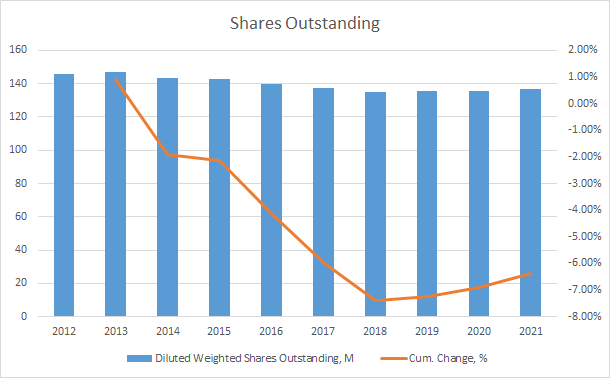
Over the last decade L&P has spent roughly $2 on dividends for every $1 net used on repurchases. Over that time the share count has fallen from 146 M to 136.7 M. That’s good for a total reduction of 6.4% or approximately a 0.7% annual decline.
As an investor in the equity side of a business, the debt and ensuing leverage plays a big role in the safety of my investment. I track the debt-to-capitalization and LT debt to equity ratios to make sure that the business doesn’t appear to be overextending itself.
LEG Debt to Capitalization (LEG SEC filings)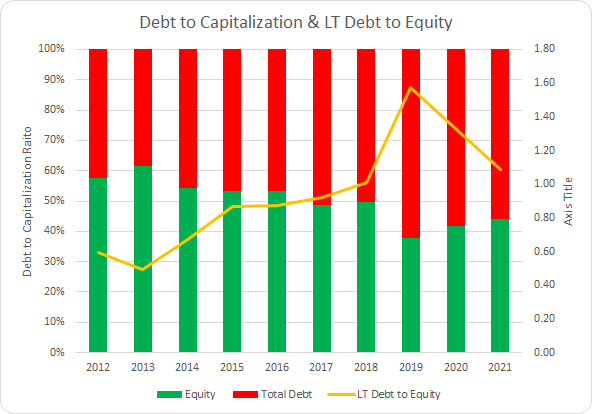
L&P’s debt-to-capitalization ratio has been rising although is still at what appear to be reasonable levels. The 10-year average debt-to-capitalization for L&P is 50% with the 5-year at 56%. Likewise, the LT debt to equity ratio has averaged 0.94 and 1.18 for the last 10- and 5-year periods, respectively.
The net debt ratios give a better idea of the leverage placed upon the business. They let you know how quickly the business could de-lever if needed.
LEG Debt Ratios and ICR (LEG SEC filings)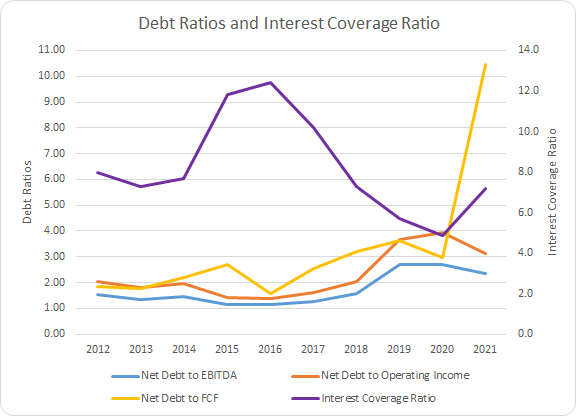
L&P has seen its net debt ratios climbing, and subsequently its interest coverage ratio falling, over the last decade. The 10-year average net debt-to-EBITDA, net debt-to-operating income, and net debt-to-FCF ratios are 1.7x, 2.3x, and 3.3x, respectively. Subsequently, the 5-year averages are 2.1x, 2.9x, and 4.6x. Similarly the interest coverage ratio has averages of 8.2x and 7.0x.
L&P’s debt appears manageable at this time assuming that FY 2021 turns out to be temporary. However, if there continues to be struggles with the housing market then additional debt could be lumped onto the balance sheet.
Valuation
When valuing a potential investment I utilize several valuation methods in order to try and home in on a fair price to pay for the business. The methods that I use are dividend yield theory, a reverse discounted cash flow analysis, and a minimum acceptable rate of return, “MARR”, analysis.
Dividend yield theory is a valuation method that centers around reversion to the mean. It operates under the assumption that investors will value a business around roughly the same dividend yield over time. For L&P I’ll use the 3-year average forward dividend yield as a proxy for fair value.
Leggett & Platt Dividend Yield Theory (LEG Investor Relations and Google Finance)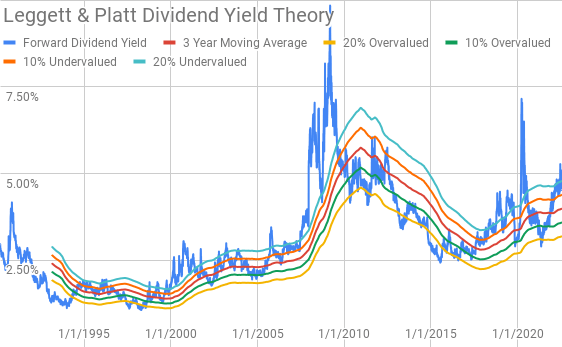
As we can see in the historic dividend yield chart, L&P’s dividend yield has fluctuated pretty significantly the last 30 years. Of course that’s to be expected as the business matures or hits a rough patch the yield is likely to head higher over time as investors demand a higher yield to compensate for the increased risk or slower growth.
The yield bands do appear to be relatively good predictors of at least short- to medium-term under or over valuation. The 3-year average forward dividend for L&P is 3.99% compared to the current forward dividend yield of 4.55%.
A reverse discounted cash flow analysis can be used as a reality check on what you have to believe a business is able to generate in terms of free cash flow in order to generate the returns that you desire from your investments. The reverse DCF starts with the current value of the business and works backwards to figure out what kind of growth and margins the business must maintain.
I use a simplified DCF model based on revenue growth, an initial free cash flow margin of 7.0% that improves to 10.0% across the forecast period, and a terminal growth rate of 2.0%.
I use a WACC using the 5-year average post-tax cost of debt of 3.2% and use a cost of equity of 10% and 8%. Therefore the WACC’s come to 8.1% and 6.6%, respectively.
Under those assumptions L&P needs to grow revenues at just a 0.1% annual rate between FY 2022 and FY 2031 in order to justify the 8.1% WACC / 10% cost of equity. In the 6.6% WACC / 8% cost of equity scenario revenue growth can be -3.9% during the forecast period. Even using a 9.5% WACC / 12% cost of equity L&P’s required revenue growth needs to be just 3.4% annually.
Currently, analysts expect L&P to have FY 2022 EPS of $2.72 and FY 2023 EPS of $2.76. They also expect L&P to be able to grow EPS at a 5.2% annual rate over the next 5 years. I then assumed that EPS growth would slow to just 3.0% annually for the following 5 years. Dividends are assumed to target a 57.5% payout ratio.
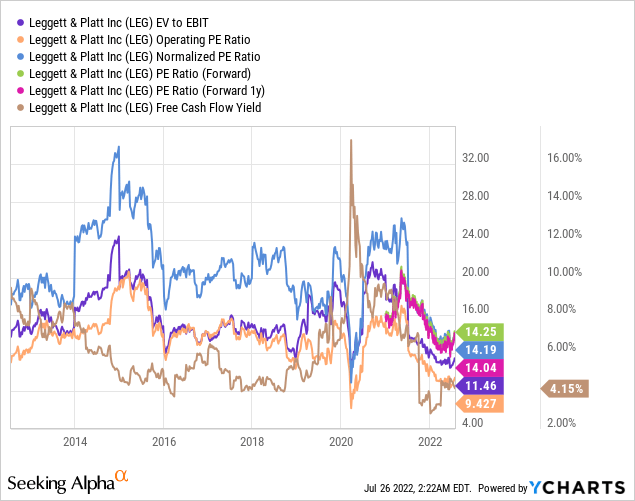
In order to determine a reasonable multiple that L&P will be valued at in the future I like to see how the business has been valued by investors over time. As you can see in the following YCharts, L&P has usually been valued between ~15x and ~25x.
The following table shows the potential internal rates of return that L&P could generate if the assumptions laid out above play out in the future. Returns assume that dividends are taken in cash and paid, as well as increased, along the historic timeline that L&P has followed. Shares are assumed to be purchased at $38.71, Monday’s closing price.
| IRR | ||
| P/E Level | 5 Year | 10 Year |
| 25 | 22.7% | 13.8% |
| 22.5 | 20.0% | 12.7% |
| 20 | 17.1% | 11.5% |
| 17.5 | 13.9% | 10.2% |
| 15 | 10.4% | 8.7% |
| 12.5 | 6.3% | 7.0% |
Source: Author
Additionally I use the MARR analysis framework to determine the maximum price I could pay for shares today in order to generate the returns that I desire from my investments based upon the respective terminal multiples. My base hurdle rate is a 10% IRR and for L&P I’ll also examine 12% and 8% return targets.
| Purchase Price Targets | ||||||
| 10% Return Target | 12% Return Target | 8% Return Target | ||||
| P/E Level | 5 Year | 10 Year | 5 Year | 10 Year | 5 Year | 10 Year |
| 25 | $62 | $52 | $57 | $45 | $67 | $60 |
| 22.5 | $56 | $48 | $52 | $41 | $61 | $55 |
| 20 | $51 | $44 | $47 | $38 | $55 | $51 |
| 17.5 | $45 | $40 | $42 | $35 | $49 | $46 |
| 15 | $40 | $36 | $37 | $31 | $43 | $41 |
| 12.5 | $34 | $32 | $32 | $28 | $37 | $37 |
Source: Author
Conclusion
L&P has been a proven winner over time and the business dates back to the 1880s. L&P is tied pretty closely to the state of the housing market as new home buyers will more than likely purchase new furnishings for a new home.
L&P has been a rather slow grower with revenues only up 3.5% annually from FY 2012 through FY 2021. Margins have typically been stable, although not the highest with a longer run average around 8.5%. L&P’s FCF ROICs have been solid through coming in at >10% each year over the last decade except for FY 2021.
Dividend yield theory suggests that L&P is significantly undervalued at current prices which offer a forward dividend yield of 4.55%. The fair value range based on dividend yield theory comes to $40 to $49.
Meanwhile, L&P looks quite undervalued based on the MARR analysis as well. Assuming a 10% return target and a terminal multiple between 15x and 20x, L&P the fair value range is $40 to $51.
The reverse DCF also suggests that L&P is cheap at the current market valuation. L&P doesn’t need herculean growth to potentially provide solid returns.
L&P is in the midst of its second largest drawdown of the last decade, the largest being during the 2020 pandemic induced pullback. Since peaking in May 2021 shares retreated roughly 40% and currently sit 33% off those highs.
Consumers are clearly feeling the pain of inflation which has hurt L&P. If this continues I would expect to see continued pullback and deferring of discretionary purchases further worsening L&P’s near term outlook.
It looks to be that L&P was caught being too aggressive with their inventory and were caught up some in the stimulus spending and euphoria of 2H 2020 and 2021.
The question is whether L&P has been materially damaged and whether they can do fine if we see an extended contraction, specifically in the housing market. If that extended contraction plays out my concern would be that L&P could be forced to raise capital via equity or debt, neither of which would do well for investors buying today. However, I currently weigh that scenario pretty low at this time as their debt maturity schedule is well spread out.
Of course demographics will play a role in how L&P fares. Millennials and Gen Z have been late, compared to previous generations, in household formations and thus in turn demand for house furnishings such as what L&P offers. That is a potential tailwind for L&P as well as the housing sector in general.
The hurdle for L&P is very low in order to generate solid returns for investors. With the share price pulling back L&P offers an initial dividend yield not seen since the 2020 selloff and prior to that 2012. That’s a pretty solid starting point for a company with a strong history of surviving and thriving for nearly 130 years.
In my opinion L&P looks quite cheap at the current valuation although I’m not sure that I’m comfortable enough with the business quality for it to be a buy and forget about holding at this time. However, L&P does appear to be an intriguing opportunity for investors looking for a bit more yield from their investments. If management is able to deliver on its target for 6-9% annual revenue growth then that story would easily flip for me.
[ad_2]
Source link


