
[ad_1]
New Zealand Dollar, NZD/USD, US CPI, Technical Analysis, Retail Trader Positioning – Sentiment Weekly
- New Zealand Dollar sinks in worst day since March 2020
- The US CPI report beat may lead to a more hawkish Fed
- Retail traders boost NZD/USD long bets, a bearish signal
Recommended by Daniel Dubrovsky
Trading Forex News: The Strategy
The New Zealand Dollar plunged against the US Dollar on Tuesday as NZD/USD sank 2.22%. That was the worst single-day performance since March 2020. What caused such a dramatic reversal after a few days of cautious gains? It was August’s US CPI report. The headline rate of inflation clocked in at 8.3% y/y versus 8.1% estimated, a slower-than-expected weakening from 8.5% recorded in July.
More worryingly for the Federal Reserve, the stickier core gauge unexpectedly strengthened to 6.3% y/y from 5.9% prior. A 6.1% outcome was estimated by economists. The divergence between headline and core gauge could be explained by falling energy prices in recent months. Meanwhile, shelter prices accelerated amid soaring rents.
All this is translating into a potentially more aggressive Fed. According to the CME FedWatch Tool, the odds of a 75-basis point rate hike this month stand around 66%. A full 100-basis point surge is seen with a near 33% probability. This continues to make the Fed the most aggressively hawkish developed central bank, pressuring the New Zealand Dollar as the US Dollar surged.
New Zealand Dollar Sentiment Outlook – Bearish
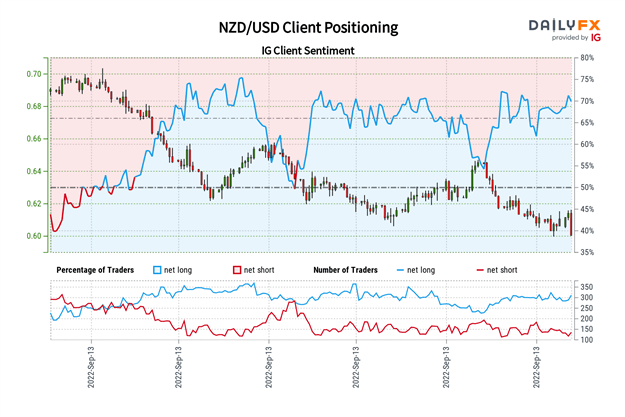
How are retail traders reacting in NZD/USD? According to IG Client Sentiment (IGCS), they boosted upside exposure and dramatically pared back downside bets. IGCS can at times function as a contrarian indicator. If this trend in positioning continues, more pain might be in store for NZD/USD. For a deeper dive into how you can use this tool, check out the webinar recording above!
The IGCS gauge shows that about 75% of retail traders are net-long NZD/USD. Since most traders are biased to the upside, this suggests that prices may continue falling. This is as short bets decreased by 20.77% and 25.36% compared to yesterday and last week, respectively. With that in mind, the combination of current and recent changes in IGCS is offering a stronger bearish contrarian trading bias.
Recommended by Daniel Dubrovsky
How is IG Client Sentiment a contrarian indicator?
NZD/USD Daily Chart
NZD/USD closed at its lowest since May 2020 on Tuesday, also taking out the September 7th low at 0.5997. That has opened the door to extending the dominant downtrend. The pair also pivoted lower right on the 20-day Simple Moving Average, which seems to be key resistance. Back in August, the pair turned lower on the 100-day equivalent. Immediate support appears to be the 100% Fibonacci extension at 0.5953. Extending losses would expose the 123.6% level at 0.5832.
Starts in:
Live now:
Sep 27
( 21:09 GMT )

Recommended by Daniel Dubrovsky
What Do Other Traders’ Buy/Sell Bets Say About Price Trends?
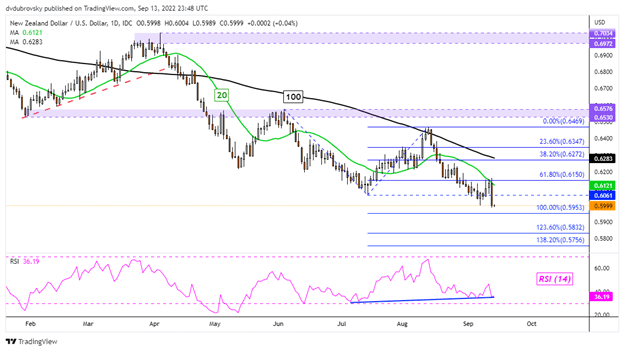
Chart Created in Trading View
*IG Client Sentiment Charts and Positioning Data Used from September 13th Report
— Written by Daniel Dubrovsky, Strategist for DailyFX.com
To contact Daniel, use the comments section below or @ddubrovskyFX on Twitter
[ad_2]
Source link


