[ad_1]
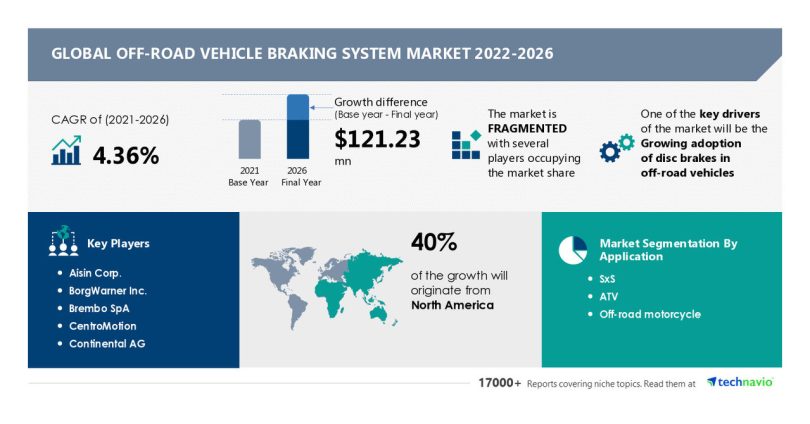
NEW YORK, Nov. 15, 2022 /PRNewswire/ — The “Off-road Vehicle Braking System Market” report has been added to Technavio’s offering. With ISO 9001:2015 certification, Technavio is proudly partnering with more than 100 Fortune 500 companies for over 16 years. The potential growth difference for the off-road vehicle braking system market between 2021 and 2026 is USD 121.23 million. To get the exact yearly growth variance and the Y-O-Y growth rate, Request a Free Sample Report.
Off-road Vehicle Braking System Market: Dynamics:

- Market Driver
- One of the main factors propelling the off-road vehicle braking system market growth is the increasing use of disc brakes in off-road vehicles. Due to the strong stopping power of disc brakes and the fact that they cool down more quickly than drum brakes as they are mounted outside the wheel, disc brakes are being used more frequently in off-road vehicles. In addition, disc brakes increase the durability of the wheels compared to drum brakes, which gradually weaken the wheels while in use. They are also much easier to clean and maintain than drum brakes. These disc brake-related elements will propel the off-road vehicle braking system market during the forecast period.
- Market Challenges
- One of the issues preventing the off-road vehicle braking system industry from growing is the design challenges brought on by complex braking systems. Off-road vehicles have several installation limitations regarding available space and the best placement.
- For instance, the ideal position is crucial for the installation of ABS because the control unit contains a computer chip that might be harmed by the extreme vibrations and noise that an off-road vehicle generates.
- Additionally, an off-road ABS is made up of a variety of complex parts, making ABS for end users quite intricate and challenging. Furthermore, an ABS’s complexity necessitates the presence of trained experts to repair these systems in the event of any flaw that raises the cost of repairs. These difficulties could limit the market’s expansion for off-road vehicle braking systems during the forecast period.
To learn about additional key drivers, trends, and challenges available with Technavio. Download Free Sample Report right now!
Off-road Vehicle Braking System Market: Vendor Offerings
- Aisin Corp.: The company offers off-road vehicle braking systems such as electronically controlled brake systems, disc brakes, and active rear steering systems.
- Brembo SpA: The company offers off-road vehicle braking systems with extreme controllability, as grip may vary wildly in off-road conditions.
- CentroMotion: The company offers off-road vehicle braking systems for mining, construction, agriculture, and industrial vehicles through subsidiary company Carlisle Brake and Fiction.
- Continental AG: The company offers off-road vehicle braking systems that are more compact, lighter, more economical, and feature a multi-logic architecture for higher availability and performance level.
- Hitachi Ltd.: The company offers off-road vehicle braking systems that contribute to safety and fuel efficiency through reliable braking technology.
To gain access to more vendor profiles with their key offerings available with Technavio, Buy a Sample Report Here.
Off-road Vehicle Braking System Market: Parent Market Analysis
Technavio categorizes the global off-road vehicle braking system market as a part of the global automotive components and accessories market within the global auto components market. The global automotive components and accessories market covers companies engaged in the production of parts and accessories for automobiles like passenger cars (PCs), electric vehicles (EVs), commercial vehicles (CVs), heavy-duty vehicles, all-terrain vehicles (ATVs), off-road vehicles, motorcycles, scooters, quad bikes, and three-wheelers.
The value chain of the off-road Vehicle Braking System Market includes the following core components:
- Inputs
- Inbound logistics
- Operations
- Outbound logistics
- Marketing and sales
- Service
- Support activities
- Innovation
Get lifetime access to our Technavio Insights! Subscribe to our “Basic Plan” billed annually at USD 5000.
Related Reports:
Motorcycle Airbag Jacket Market by Product and Geography – Forecast and Analysis 2022-2026: The report extensively covers the motorcycle airbag jacket market segmentation by product (airbag vest and airbag jacket) and geography (Europe, North America, APAC, South America, and the Middle East and Africa).
Automotive Radiator Fan Market by Application and Geography – Forecast and Analysis 2022-2026: The report extensively covers the automotive radiator fan market segmentations by Application (Passenger cars, LCVs, and M&HCVs) and Geographic (APAC, Europe, North America, South America, and the Middle East and Africa).
|
Off-road Vehicle Braking System Market Scope |
|
|
Report Coverage |
Details |
|
Page number |
120 |
|
Base year |
2021 |
|
Forecast period |
2022-2026 |
|
Growth momentum & CAGR |
Accelerate at a CAGR of 4.36% |
|
Market growth 2022-2026 |
$121.23 million |
|
Market structure |
Fragmented |
|
YoY growth (%) |
2.92 |
|
Regional analysis |
North America, Europe, APAC, Middle East and Africa, and South America |
|
Performing market contribution |
North America at 40% |
|
Key consumer countries |
US, China, Germany, UK, and France |
|
Competitive landscape |
Leading companies, competitive strategies, consumer engagement scope |
|
Companies profiled |
Aisin Corp., BorgWarner Inc., Brembo SpA, CentroMotion, Continental AG, Freeman Automotive UK Ltd., Hitachi Ltd., Industrias Galfer SA, Robert Bosch GmbH, Tenneco Inc., Westinghouse Air Brake Technologies Corp., Wilwood Engineering Inc., and ZF Friedrichshafen AG |
|
Market Dynamics |
Parent market analysis, Market growth inducers and obstacles, Fast-growing and slow-growing segment analysis, COVID-19 impact and future consumer dynamics, and market condition analysis for the forecast period. |
|
Customization purview |
If our report has not included the data that you are looking for, you can reach out to our analysts and get segments customized. |
Table of Contents
1 Executive Summary
- 1.1 Market overview
- Exhibit 01: Executive Summary – Chart on Market Overview
- Exhibit 02: Executive Summary – Data Table on Market Overview
- Exhibit 03: Executive Summary – Chart on Global Market Characteristics
- Exhibit 04: Executive Summary – Chart on Market by Geography
- Exhibit 05: Executive Summary – Chart on Market Segmentation by Application
- Exhibit 06: Executive Summary – Chart on Incremental Growth
- Exhibit 07: Executive Summary – Data Table on Incremental Growth
- Exhibit 08: Executive Summary – Chart on Vendor Market Positioning
2 Market Landscape
- 2.1 Market ecosystem
- Exhibit 09: Parent market
- Exhibit 10: Market Characteristics
3 Market Sizing
- 3.1 Market definition
- Exhibit 11: Offerings of vendors included in the market definition
- 3.2 Market segment analysis
- Exhibit 12: Market segments
- 3.4 Market outlook: Forecast for 2021-2026
- Exhibit 13: Chart on Global – Market size and forecast 2021-2026 ($ million)
- Exhibit 14: Data Table on Global – Market size and forecast 2021-2026 ($ million)
- Exhibit 15: Chart on Global Market: Year-over-year growth 2021-2026 (%)
- Exhibit 16: Data Table on Global Market: Year-over-year growth 2021-2026 (%)
4 Five Forces Analysis
- 4.1 Five forces summary
- Exhibit 17: Five forces analysis – Comparison between 2021 and 2026
- 4.2 Bargaining power of buyers
- Exhibit 18: Chart on Bargaining power of buyers – Impact of key factors 2021 and 2026
- 4.3 Bargaining power of suppliers
- Exhibit 19: Bargaining power of suppliers – Impact of key factors in 2021 and 2026
- 4.4 Threat of new entrants
- Exhibit 20: Threat of new entrants – Impact of key factors in 2021 and 2026
- 4.5 Threat of substitutes
- Exhibit 21: Threat of substitutes – Impact of key factors in 2021 and 2026
- 4.6 Threat of rivalry
- Exhibit 22: Threat of rivalry – Impact of key factors in 2021 and 2026
- 4.7 Market condition
- Exhibit 23: Chart on Market condition – Five forces 2021 and 2026
5 Market Segmentation by Application
- 5.1 Market segments
- Exhibit 24: Chart on Application – Market share 2021-2026 (%)
- Exhibit 25: Data Table on Application – Market share 2021-2026 (%)
- 5.2 Comparison by Application
- Exhibit 26: Chart on Comparison by Application
- Exhibit 27: Data Table on Comparison by Application
- 5.3 SxS – Market size and forecast 2021-2026
- Exhibit 28: Chart on SxS – Market size and forecast 2021-2026 ($ million)
- Exhibit 29: Data Table on SxS – Market size and forecast 2021-2026 ($ million)
- Exhibit 30: Chart on SxS – Year-over-year growth 2021-2026 (%)
- Exhibit 31: Data Table on SxS – Year-over-year growth 2021-2026 (%)
- 5.4 ATV – Market size and forecast 2021-2026
- Exhibit 32: Chart on ATV – Market size and forecast 2021-2026 ($ million)
- Exhibit 33: Data Table on ATV – Market size and forecast 2021-2026 ($ million)
- Exhibit 34: Chart on ATV – Year-over-year growth 2021-2026 (%)
- Exhibit 35: Data Table on ATV – Year-over-year growth 2021-2026 (%)
- 5.5 Off-road motorcycle – Market size and forecast 2021-2026
- Exhibit 36: Chart on Off-road motorcycle – Market size and forecast 2021-2026 ($ million)
- Exhibit 37: Data Table on Off-road motorcycle – Market size and forecast 2021-2026 ($ million)
- Exhibit 38: Chart on Off-road motorcycle – Year-over-year growth 2021-2026 (%)
- Exhibit 39: Data Table on Off-road motorcycle – Year-over-year growth 2021-2026 (%)
- 5.6 Market opportunity by Application
- Exhibit 40: Market opportunity by Application ($ million)
6 Customer Landscape
- 6.1 Customer landscape overview
- Exhibit 41: Analysis of price sensitivity, lifecycle, customer purchase basket, adoption rates, and purchase criteria
7 Geographic Landscape
- 7.1 Geographic segmentation
- Exhibit 42: Chart on Market share by geography 2021-2026 (%)
- Exhibit 43: Data Table on Market share by geography 2021-2026 (%)
- 7.2 Geographic comparison
- Exhibit 44: Chart on Geographic comparison
- Exhibit 45: Data Table on Geographic comparison
- 7.3 North America – Market size and forecast 2021-2026
- Exhibit 46: Chart on North America – Market size and forecast 2021-2026 ($ million)
- Exhibit 47: Data Table on North America – Market size and forecast 2021-2026 ($ million)
- Exhibit 48: Chart on North America – Year-over-year growth 2021-2026 (%)
- Exhibit 49: Data Table on North America – Year-over-year growth 2021-2026 (%)
- 7.4 Europe – Market size and forecast 2021-2026
- Exhibit 50: Chart on Europe – Market size and forecast 2021-2026 ($ million)
- Exhibit 51: Data Table on Europe – Market size and forecast 2021-2026 ($ million)
- Exhibit 52: Chart on Europe – Year-over-year growth 2021-2026 (%)
- Exhibit 53: Data Table on Europe – Year-over-year growth 2021-2026 (%)
- 7.5 APAC – Market size and forecast 2021-2026
- Exhibit 54: Chart on APAC – Market size and forecast 2021-2026 ($ million)
- Exhibit 55: Data Table on APAC – Market size and forecast 2021-2026 ($ million)
- Exhibit 56: Chart on APAC – Year-over-year growth 2021-2026 (%)
- Exhibit 57: Data Table on APAC – Year-over-year growth 2021-2026 (%)
- 7.6 Middle East and Africa – Market size and forecast 2021-2026
- Exhibit 58: Chart on Middle East and Africa – Market size and forecast 2021-2026 ($ million)
- Exhibit 59: Data Table on Middle East and Africa – Market size and forecast 2021-2026 ($ million)
- Exhibit 60: Chart on Middle East and Africa – Year-over-year growth 2021-2026 (%)
- Exhibit 61: Data Table on Middle East and Africa – Year-over-year growth 2021-2026 (%)
- 7.7 South America – Market size and forecast 2021-2026
- Exhibit 62: Chart on South America – Market size and forecast 2021-2026 ($ million)
- Exhibit 63: Data Table on South America – Market size and forecast 2021-2026 ($ million)
- Exhibit 64: Chart on South America – Year-over-year growth 2021-2026 (%)
- Exhibit 65: Data Table on South America – Year-over-year growth 2021-2026 (%)
- 7.8 US – Market size and forecast 2021-2026
- Exhibit 66: Chart on US – Market size and forecast 2021-2026 ($ million)
- Exhibit 67: Data Table on US – Market size and forecast 2021-2026 ($ million)
- Exhibit 68: Chart on US – Year-over-year growth 2021-2026 (%)
- Exhibit 69: Data Table on US – Year-over-year growth 2021-2026 (%)
- 7.9 China – Market size and forecast 2021-2026
- Exhibit 70: Chart on China – Market size and forecast 2021-2026 ($ million)
- Exhibit 71: Data Table on China – Market size and forecast 2021-2026 ($ million)
- Exhibit 72: Chart on China – Year-over-year growth 2021-2026 (%)
- Exhibit 73: Data Table on China – Year-over-year growth 2021-2026 (%)
- 7.10 Germany – Market size and forecast 2021-2026
- Exhibit 74: Chart on Germany – Market size and forecast 2021-2026 ($ million)
- Exhibit 75: Data Table on Germany – Market size and forecast 2021-2026 ($ million)
- Exhibit 76: Chart on Germany – Year-over-year growth 2021-2026 (%)
- Exhibit 77: Data Table on Germany – Year-over-year growth 2021-2026 (%)
- 7.11 UK – Market size and forecast 2021-2026
- Exhibit 78: Chart on UK – Market size and forecast 2021-2026 ($ million)
- Exhibit 79: Data Table on UK – Market size and forecast 2021-2026 ($ million)
- Exhibit 80: Chart on UK – Year-over-year growth 2021-2026 (%)
- Exhibit 81: Data Table on UK – Year-over-year growth 2021-2026 (%)
- 7.12 France – Market size and forecast 2021-2026
- Exhibit 82: Chart on France – Market size and forecast 2021-2026 ($ million)
- Exhibit 83: Data Table on France – Market size and forecast 2021-2026 ($ million)
- Exhibit 84: Chart on France – Year-over-year growth 2021-2026 (%)
- Exhibit 85: Data Table on France – Year-over-year growth 2021-2026 (%)
- 7.13 Market opportunity by geography
- Exhibit 86: Market opportunity by geography ($ million)
8 Drivers, Challenges, and Trends
- 8.3 Impact of drivers and challenges
- Exhibit 87: Impact of drivers and challenges in 2021 and 2026
9 Vendor Landscape
- 9.2 Vendor landscape
- Exhibit 88: Overview on Criticality of inputs and Factors of differentiation
- 9.3 Landscape disruption
- Exhibit 89: Overview on factors of disruption
- 9.4 Industry risks
- Exhibit 90: Impact of key risks on business
10 Vendor Analysis
- 10.1 Vendors covered
- Exhibit 91: Vendors covered
- 10.2 Market positioning of vendors
- Exhibit 92: Matrix on vendor position and classification
- 10.3 Aisin Corp.
- Exhibit 93: Aisin Corp. – Overview
- Exhibit 94: Aisin Corp. – Business segments
- Exhibit 95: Aisin Corp. – Key offerings
- Exhibit 96: Aisin Corp. – Segment focus
- 10.4 Brembo SpA
- Exhibit 97: Brembo SpA – Overview
- Exhibit 98: Brembo SpA – Business segments
- Exhibit 99: Brembo SpA – Key news
- Exhibit 100: Brembo SpA – Key offerings
- Exhibit 101: Brembo SpA – Segment focus
- 10.5 CentroMotion
- Exhibit 102: CentroMotion – Overview
- Exhibit 103: CentroMotion – Product / Service
- Exhibit 104: CentroMotion – Key offerings
- 10.6 Continental AG
- Exhibit 105: Continental AG – Overview
- Exhibit 106: Continental AG – Business segments
- Exhibit 107: Continental AG – Key news
- Exhibit 108: Continental AG – Key offerings
- Exhibit 109: Continental AG – Segment focus
- 10.7 Freeman Automotive UK Ltd.
- Exhibit 110: Freeman Automotive UK Ltd. – Overview
- Exhibit 111: Freeman Automotive UK Ltd. – Product / Service
- Exhibit 112: Freeman Automotive UK Ltd. – Key offerings
- 10.8 Hitachi Ltd.
- Exhibit 113: Hitachi Ltd. – Overview
- Exhibit 114: Hitachi Ltd. – Business segments
- Exhibit 115: Hitachi Ltd. – Key news
- Exhibit 116: Hitachi Ltd. – Key offerings
- Exhibit 117: Hitachi Ltd. – Segment focus
- 10.9 Industrias Galfer SA
- Exhibit 118: Industrias Galfer SA – Overview
- Exhibit 119: Industrias Galfer SA – Product / Service
- Exhibit 120: Industrias Galfer SA – Key offerings
- 10.10 Robert Bosch GmbH
- Exhibit 121: Robert Bosch GmbH – Overview
- Exhibit 122: Robert Bosch GmbH – Business segments
- Exhibit 123: Robert Bosch GmbH – Key news
- Exhibit 124: Robert Bosch GmbH – Key offerings
- Exhibit 125: Robert Bosch GmbH – Segment focus
- 10.11 Wilwood Engineering Inc.
- Exhibit 126: Wilwood Engineering Inc. – Overview
- Exhibit 127: Wilwood Engineering Inc. – Product / Service
- Exhibit 128: Wilwood Engineering Inc. – Key offerings
- 10.12 ZF Friedrichshafen AG
- Exhibit 129: ZF Friedrichshafen AG – Overview
- Exhibit 130: ZF Friedrichshafen AG – Business segments
- Exhibit 131: ZF Friedrichshafen AG – Key news
- Exhibit 132: ZF Friedrichshafen AG – Key offerings
- Exhibit 133: ZF Friedrichshafen AG – Segment focus
11 Appendix
- 11.2 Inclusions and exclusions checklist
- Exhibit 134: Inclusions checklist
- Exhibit 135: Exclusions checklist
- 11.3 Currency conversion rates for US$
- Exhibit 136: Currency conversion rates for US$
- 11.4 Research methodology
- Exhibit 137: Research methodology
- Exhibit 138: Validation techniques employed for market sizing
- Exhibit 139: Information sources
- 11.5 List of abbreviations
- Exhibit 140: List of abbreviations
About Us
Technavio is a leading global technology research and advisory company. Their research and analysis focuses on emerging market trends and provides actionable insights to help businesses identify market opportunities and develop effective strategies to optimize their market positions.
With over 500 specialized analysts, Technavio’s report library consists of more than 17,000 reports and counting, covering 800 technologies, spanning across 50 countries. Their client base consists of enterprises of all sizes, including more than 100 Fortune 500 companies. This growing client base relies on Technavio’s comprehensive coverage, extensive research, and actionable market insights to identify opportunities in existing and potential markets and assess their competitive positions within changing market scenarios.
Contact
Technavio Research
Jesse Maida
Media & Marketing Executive
US: +1 844 364 1100
UK: +44 203 893 3200
Email:[email protected]
Website: www.technavio.com/
SOURCE Technavio

[ad_2]
Source link


