
[ad_1]
kokkai/iStock Unreleased via Getty Images
As the largest internet retailer in Southeast Asia, we analyzed Sea Limited’s (NYSE:SE) competitive positioning as the leading e-commerce retailer in the region. We also examined its e-commerce expansion into LATAM, in which it has already secured a leading position.
Sea, Khaveen Investments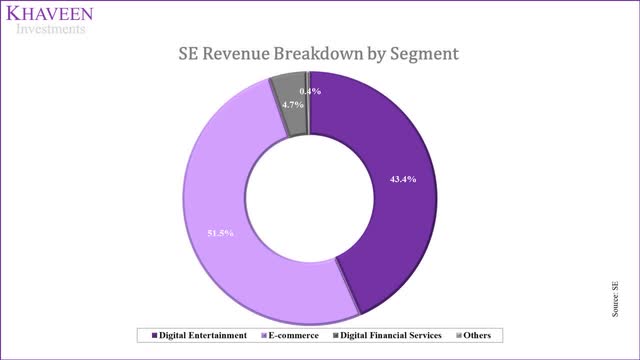
While 51.5% of its revenue is derived from Internet Retail, Sea also derives 43.4% of its revenue from gaming revenues under its Digital Entertainment Segment. Looking further into this segment, we believe this segment’s revenue is highly dependent on its only in-house developed game, Free Fire.
We also noticed the company’s significant initiatives in the Fintech Industry, which we believe could be a major driver of the company’s growth moving forward. To determine its potential market share gain in this market, we looked at other companies that deployed similar business model mixes of Internet Retail and Fintech, such as Alibaba (BABA, BABAF) and MercadoLibre (MELI).
E-Commerce Leader of the Developing World
Sea, Khaveen Investments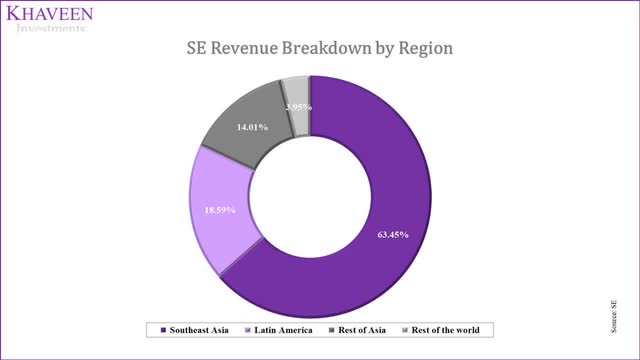
With 63.45% of the company’s total revenue derived from Southeast Asia, we believed the company would hold a dominant position in this region. To determine Shopee’s (Sea Limited) competitive positioning in Southeast Asia, we looked into monthly web visits of more than 49 e-commerce platforms across this region from iPrice. We calculated their market share from Q1 2019 to Q4 2021 across the top 6 countries in Southeast Asia by GDP (Indonesia, Thailand, Vietnam, Philippines, Singapore and Malaysia). To determine the growth prospects of the market, we also compiled data on the size, and historical 5-year and forward 4-year CAGR of the Internet Retail industry (in terms of the Internet Retail transaction volumes from Statista).
iPrice, Khaveen Investments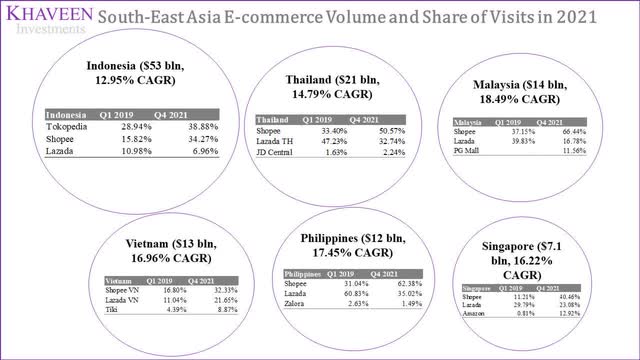
Based on the chart above, Shopee’s market share has increased significantly in all 6 markets from Q1 2019 to Q4 2021. In Vietnam, they strengthened their No. 1 position against Lazada in Q1 2019. In Thailand, Malaysia, the Philippines, and Singapore, Shopee grew from the No. 2 Position to unseat Lazada from the No. 1 position. Even in Indonesia, where Tokopedia remains at No. 1, Shopee has closed the gap considerably to Tokopedia, with their market share more than doubling from 15.82% to 34.27%. Although Tokopedia also gained market share, Shopee now remains just 4.61% market share points behind Tokopedia. Additionally, Shopee has more than 50% market share in Thailand, Malaysia and the Philippines. As Tokopedia is not even in the Top 3 positions in any country outside Indonesia, we see Shopee as the undisputed e-commerce leader in Southeast Asia.
In 2021, Indonesia was the largest market with $53 bln (more than twice the size of 2nd place Thailand) in transaction volumes fueled by its historical CAGR of 74.1% which has been the highest among the 6 countries. Surprisingly, Sea Limited, a Singaporean company, only has a 40.46% market share which is the second-lowest in terms of market share. Singapore also has the smallest transaction volume of $7.1 bln, which is 13.40% of Indonesia’s transaction volume. We tabulated the results of each country’s transaction volume per GDP as below:
|
Geographic Region |
2021 Shopee Market Share |
2021 Market Sales Volume ($ bln) |
2021 Shopee Sales Volume ($ bln) |
Share of Total Volume |
2020 GDP ($bln) |
Sales Volume/GDP |
GDP Growth % (2022F) |
|
Indonesia |
38.88% |
53 |
20.6 |
37.4% |
1,058 |
5.0% |
5.4% |
|
Vietnam |
32.33% |
13 |
4.2 |
7.6% |
271 |
4.8% |
6.0% |
|
Thailand |
50.57% |
21 |
10.6 |
19.3% |
502 |
4.2% |
3.3% |
|
Philippines |
62.38% |
12 |
7.5 |
13.6% |
361 |
3.3% |
6.5% |
|
Malaysia |
66.44% |
14 |
9.3 |
16.9% |
337 |
4.2% |
5.6% |
|
Singapore |
40.46% |
7.1 |
2.9 |
5.2% |
340 |
2.1% |
4.0% |
|
Total |
55.1 |
Source: Statista, IMF, Khaveen Investments
As seen, Singapore has the lowest transaction volume per GDP, while Indonesia has the highest followed by Vietnam. In terms of 2022 expected GDP growth, Thailand is the lowest (3.30%) while the Philippines is the highest (6.5%), and Vietnam has the second highest (6%). In terms of our analysis of transaction volume/GDP and GDP growth rates, we see the Philippines market as having the best prospects while Singapore has the worst.
To determine the appropriate gauge of its e-commerce revenue breakdown, we first derived its monthly views breakdown by region. We then factor in its market share of total transaction volumes based on its web traffic share, multiplied by the overall transaction volume size of each country.
|
Sea Southeast Asia E-commerce ($ mln) |
2021 |
2022F |
2023F |
2024F |
2025F |
2026F |
|
Estimated Southeast Asia GMV (‘a’) |
59,094 |
68,152 |
78,627 |
90,743 |
104,764 |
120,994 |
|
Growth (%) |
66.93% |
15.33% |
15.37% |
15.41% |
15.45% |
15.49% |
|
Take Rate (‘b’) |
8.67% |
10.78% |
12.89% |
15.01% |
17.12% |
19.23% |
|
Increase % |
2.55% |
2.11% |
2.11% |
2.11% |
2.11% |
2.11% |
|
Southeast Asia E-commerce Revenue (‘c’) |
5,123 |
7,348 |
10,138 |
13,618 |
17,935 |
23,270 |
|
Growth % |
43.43% |
37.97% |
34.32% |
31.70% |
29.74% |
*c = a x b
Source: Sea, Khaveen Investments
If we assume the company’s take rate is the same in all countries, we see this as a good gauge of its revenue breakdown. Overall, we see the company’s main e-commerce markets as Indonesia (33.2%), followed by Thailand (20.2%) and Malaysia (16.0%). In terms of forecasted growth rates, the average is 16.14% based on Statista. While Indonesia is the largest market, Statista forecasts Indonesia’s forward growth at just 12.95% which is the slowest moving forward.
On the other hand, 3rd placed Malaysia (with $14 bln in transaction volumes) is forecasted to be the fastest-growing in the region with an 18.49% forward CAGR. To obtain the company’s weighted average transaction volumes growth moving forward excluding take rate increase and market share gain, we calculated the weighted growth based on Statista country forecasts. To calculate the company’s historical take rate, we compiled data on the company’s past e-commerce revenue and GMV. The average annual take rate increase since 2017 has been 2.11%. Overall, we projected its Southeast Asia e-commerce revenue to grow by 43.4% in 2022 and a 5-year forward average of 35.4%.
E-Commerce Leader of LATAM
Besides Southeast Asia, the company had expanded into Latin America’s e-commerce markets such as Brazil in 2019 and recently 2021, Mexico, Chile and Colombia. In the past 3 years, its revenue contribution from the LATAM region has increased from 13% to 18.6% in 2021 based on its annual report. According to Apptopia, within 2 years of its launch, Shopee overtook Amazon (AMZN) and MercadoLibre to become the leading shopping app by monthly active users with a share of over 30% in 2021.
Apptopia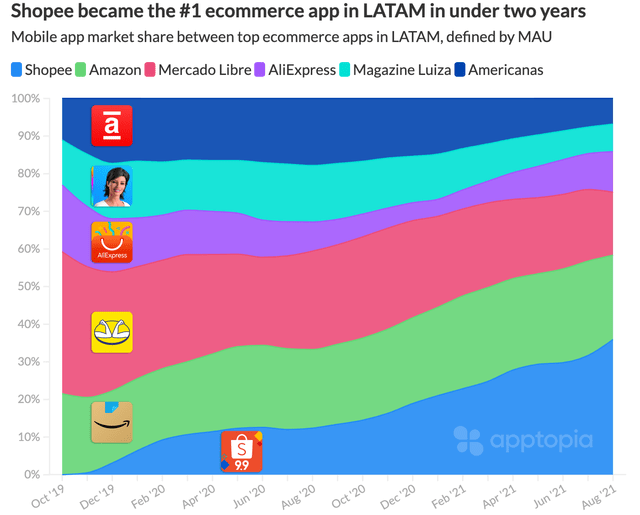
Although Shopee is based in Singapore, it depends heavily on sellers from China which makes up the majority of its sellers on its platform. According to KPMG, China was ranked the second-lowest in terms of its manufacturing costs index. Thus, we believe this indicates Shopee’s advantage by keeping costs low. According to analyst Thiago Macruz from Itaú, Shopee carved a niche by selling low-cost products with free shipping. However, in Brazil, Shopee has also grown its number of local sellers to over 1 mln and has become the majority of its marketplace sellers. Previously, it charged low commission fees (6%) in comparison to competitors such as MercadoLibre at 17% but had raised its fees higher than Mercado.
According to Macruz, another factor is Shopee’s focus on enhancing its user experience through gamification on Shopee’s platform with mini-games that provides rewards. Furthermore, the company’s management explained in the latest earnings briefing that is committed to improving its tech capabilities and experience for users.
Just two years after entering Brazil, the world’s sixth largest market by population, we are making rapid progress towards market leadership. We therefore remain focused on high quality execution alongside consistent innovation and investments in our tech capabilities to provide a differentiated experience to our users. – Forrest Li, CEO
|
LATAM E-commerce Market ($bln) |
2021 |
2022F |
2023F |
2024F |
2025F |
|
LATAM Market Size ($ bln) |
85 |
104 |
121 |
138 |
160 |
|
Growth % |
25.0% |
22.4% |
16.3% |
14.0% |
15.9% |
|
Shopee Market Share |
4% |
6% |
10% |
18% |
30% |
|
Shopee LATAM GMV |
3.13 |
6.20 |
12.26 |
24.26 |
48 |
|
Growth % |
97.9% |
97.9% |
97.9% |
97.9% |
Source: Fidelity, Morgan Stanley, YipitData, Khaveen Investments
All in all, we expect the company to capitalize on the LATAM e-commerce market opportunity as it had already secured a lead over competitors despite its recent entry and as it expands into other regions within LATAM supported by its cost advantages and focus on user engagement. According to Fidelity, the LATAM e-commerce market is forecasted to grow to $160 bln by 2025. According to YipitData, Sea’s GMV from Brazil was estimated to have accounted for 5.3% of its GMV. Assuming Shopee’s share of 30% based on its MAU share from Apptopia, we estimated its GMV opportunity to be $48 bln by 2025 which is 31% of its total forecasted GMV. Overall, we projected its total e-commerce (including LATAM and Southeast Asia) revenue to grow by an average of 50.5% through 2025.
|
Sea Total E-commerce Forecast ($ mln) |
2020 |
2021 |
2022F |
2023F |
2024F |
2025F |
|
GMV |
35,400 |
59,094 |
68,152 |
78,627 |
90,743 |
104,764 |
|
Add: LATAM GMV |
3,506 |
6,197 |
12,261 |
24,260 |
48,000 |
|
|
Total GMV |
35,400 |
62,600 |
74,349 |
90,888 |
115,003 |
152,764 |
|
Growth % |
102.29% |
76.84% |
18.77% |
22.24% |
26.53% |
32.83% |
|
Take Rate % |
6.1% |
8.7% |
10.8% |
12.9% |
15.0% |
17.1% |
|
E-commerce Revenue |
2,167 |
5,123 |
8,016 |
11,719 |
17,258 |
26,152 |
|
Growth % |
159.75% |
136.40% |
56.47% |
46.20% |
47.26% |
51.53% |
Source: Sea, Fidelity, Morgan Stanley, YipitData, Khaveen Investments
FinTech Expansions
Moreover, the company also has a fintech segment which provides e-wallet payment services through SeaMoney as well as credit lending. In Indonesia, ShopeePay was the most popular e-wallet at a 68% user penetration rate ahead of competitors OVO and DANA. However, GCash was the most popular in the Philippines and GrabPay (GRAB) in Malaysia and Singapore.
Temasek, Bain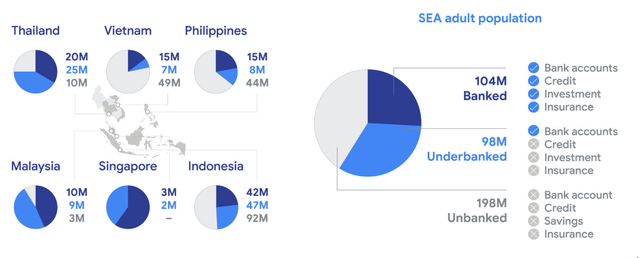
Based on the chart above by Temasek and Bain of the breakdown of the SEA population by banked, underbanked and unbanked categories, the region with the largest share of the unbanked population in Vietnam represents almost 70% of the population. This is followed by the Philippines and Indonesia. However, Indonesia has the largest unbanked population at 92 mln. Thus, we believe the vast underbanked and unbanked population presents the company with an opportunity to capitalize on its fintech expansion.
Besides digital payments, the company had applied for and was awarded digital banking licenses from Singapore and Malaysia’s central banks. The company also acquired an Indonesian bank, Bank BKE, in 2021. Its competitor Gojek acquired Bank Jagoas to offer financial services to merchants and drivers. From its latest earnings briefing, the company explained that besides e-wallets, the company also offered more products such as offering credit to consumers and merchants and insurance as well as the possibility of wealth management products in the future.
And in other markets, we are also rolling out increasing number of SeaMoney products, including continue to strengthen our market leadership on the e-wallet side, and the leveraging that offer more products across credit to both the consumers and our SME merchants, and also the insurance product – Intertek products, and potentially down the road wealth management products, of course in collaboration with financial institutions, and our digital banking products also being rolled out not only in Indonesia. – Yanjun Wang, Group Chief Corporate Officer
We believe Sea’s expansion into fintech is comparable to Alibaba’s Ant Group whose operations span digital payments, lending, insurance and wealth management. Founded in 2014, the company had managed to achieve around $18 bln in revenue in its fourth year. Based on the Fintech market revenue in 2018 by Deloitte of $108.6 bln, we calculated its market share by its segments. In comparison, MercadoLibre had also expanded into fintech more recently in 2018 but only focused on digital wallets with Mercado Pago in Argentina.
|
Ant Group |
Revenue ($ bln) |
Market Share |
|
Digital Payments |
7 |
6.4% |
|
Digital Lending |
3.5 |
3.3% |
|
Insurance |
0.7 |
0.6% |
|
Total Ant |
11.2 |
10% |
|
MercadoLibre |
Revenue ($ bln) |
Market Share |
|
Digital Payments |
2 |
1.4% |
Source: Ant Group, MercadoLibre, Deloitte, Khaveen Investments
According to management in its earnings briefing, it highlighted that adoption of its credit products was a key driver of revenue growth and expected it to continue. Also, it stated that 30% of active users have used multiple SeaMoney products. Additionally, it also announced that it had obtained a financial institution license in Brazil which could allow it to expand internationally.
We estimated the company’s Fintech market opportunity in 2025 based on Ant Group and MercadoLibre’s market share in its fourth year and the projected fintech market size of $284 bln by 2025 at a CAGR of 13.9%.
|
Sea Fintech |
Revenue ($ bln) (2025F) |
Market Share |
|
Digital Payments |
11.2 |
3.9% |
|
Digital Lending |
9.3 |
3.3% |
|
Insurance |
1.8 |
0.6% |
|
Total Sea |
22.2 |
7.8% |
Source: Khaveen Investments
|
Segments ($ mln) |
2020 |
2021 |
2022F |
2023F |
2024F |
2025F |
|
Digital Financial Services |
61 |
470 |
1,232 |
3,229 |
8,468 |
22,201 |
|
Growth (%) |
560.87% |
672.65% |
162% |
162% |
162% |
162% |
Source: Khaveen Investments
As the company expands into Fintech such as with SeaMoney in digital payments, lending and insurance, we believe the company’s segment outlook is buoyed by the large underbanked and unbanked population within the SEA region, especially in large markets such as Indonesia, Vietnam and Philippines. As the company secured digital banking licenses, we expect it to continue focusing on its fintech expansion to target these markets. Moreover, we also view its expansion into Fintech as similar to other e-commerce platforms such as Ant Group and MercadoLibre. As such, we projected its fintech segment with a revenue opportunity of $22.2 bln by 2025 based on the market share of its Ant Group and MercadoLibre.
Risk: High Dependency on Free Fire
The company’s largest segment is digital entertainment which was 43% of total revenue. The company’s most popular game is FreeFire which contributed $1.1 bln or 26% of its total revenue in 2021 according to Pocket Gamer. Based on Apptopia, the average life span of games to stay within the top 50 in the app store was only 27.75 days. That said, Freefire was launched in 2017 but its daily active users have still increased in 2021 to a peak of 150 mln in Q2 compared to its active users of 80 mln in 2020 and 50 mln in the prior year. Recently in 2022, India banned the FreeFire game along with 54 Chinese apps due to security concerns. According to App Annie, the game was the highest-grossing mobile game in India in Q3 2021. Though, Morgan Stanley (MS) estimated its sales from the country to be $475 mln or 11% of its segment revenue in 2021.
Valuation
We summarized our revenue projections for the company in the table below according to its digital entertainment which we projected based on the market forecast CAGR of 11.9% as well as its e-commerce and digital financial services segments based on our projections as discussed above.
|
Segments ($ mln) |
2021 |
2022F |
2023F |
2024F |
2025F |
|
Digital Entertainment |
4,320 |
4,834 |
5,409 |
6,053 |
6,773 |
|
Growth (%) |
114.29% |
11.90% |
11.90% |
11.90% |
11.90% |
|
E-commerce |
5,123 |
8,016 |
11,719 |
17,258 |
26,152 |
|
Growth (%) |
136.40% |
56.47% |
46.20% |
47.26% |
51.53% |
|
Digital Financial Services |
470 |
1,232 |
3,229 |
8,468 |
22,201 |
|
Growth (%) |
672.65% |
162% |
162% |
162% |
162% |
|
Other Services |
42 |
42 |
42 |
42 |
42 |
|
Growth (%) |
-67.83% |
0.00% |
0.00% |
0.00% |
0.00% |
|
Total Revenue |
9,955 |
14,124 |
20,401 |
31,821 |
55,169 |
|
Growth (%) |
127.51% |
41.88% |
44.44% |
55.98% |
73.37% |
Source: Khaveen Investments
To value the company, we used a P/S valuation as we forecasted its revenue growth to grow robustly above 40%. We based its P/S ratio on the weighted average of competitors for its digital entertainment and e-commerce segments.
|
Weighted Average P/S |
Weight |
P/S |
|
Gaming |
43.4% |
4.43x |
|
E-commerce |
51.5% |
3.09x |
|
Weighted P/S |
3.51x |
Source: Khaveen Investments
Based on a weighted P/S of 3.51x, we derived its 2024 price target with an upside of 146%. Based on that, we derived a 2022 price target with an upside of 35%.
|
Valuation |
2022F |
2023F |
2024F |
|
Revenue |
14,124 |
20,401 |
31,821 |
|
P/S |
3.51x |
3.51x |
3.51x |
|
Valuation ($ mln) |
49,575 |
71,605 |
111,691 |
|
Shares Outstanding |
559.74 |
559.74 |
559.74 |
|
Price Target |
$105.10 |
$144.82 |
$199.54 |
|
Current Price |
$76.28 |
$76.28 |
$76.28 |
|
Upside |
37.8% |
89.9% |
161.6% |
Source: Khaveen Investments
Verdict
Sea has grown over the years to become the leader of e-commerce in Southeast Asia which is a key region accounting for 63% of its revenues. Based on our projection of its estimated GMV by country in Southeast Asia, we projected its e-commerce revenue in the region to grow by 43.4% in 2022. Furthermore, as the company expands into LATAM such as Brazil, Mexico, Chile, and Colombia, we believe the region could present it with an e-commerce GMV opportunity of $48 bln or 50% of its GMV by 2025 as it had already secured a lead with over 30% share of active users.
Lastly, we believe that its Fintech expansion opportunities could be supported by the large underbanked population in southeast Asia as it offers digital payments, digital lending, and insurance products similar to Ant Group and MercadoLibre and we projected its revenue opportunity to $22 bln by 2025. Overall, we rate the company as a Strong Buy with a target price of $105.10.
[ad_2]
Source link


