[ad_1]
XRD analysis
The phase structures of the composite samples were determined by XRD (Fig. 2). In the XRD pattern of MWCNTs, a sharp peak appeared at 26.0° corresponding to (002) reflection. The diffraction peaks of ZnO nanoflowers at 2θ = 31.84°, 34.53°, 36.35°, and 49.8° were related to (100), (002), (101), and (102) reflections, confirming that they possessed a hexagonal wurtzite structure (JCPDS 79-0207)15. In the XRD spectra of MoWO4, the peak appeared from the (002) plane of WO3 was stronger than other peaks, and it happened due to the preferred orientation of WO3 under the effect of Mo atoms (Fig. 2c). It is confirmed from Fig. 2d that the as-prepared MW-Z@MWCNTs were composed of an interconnected structure.
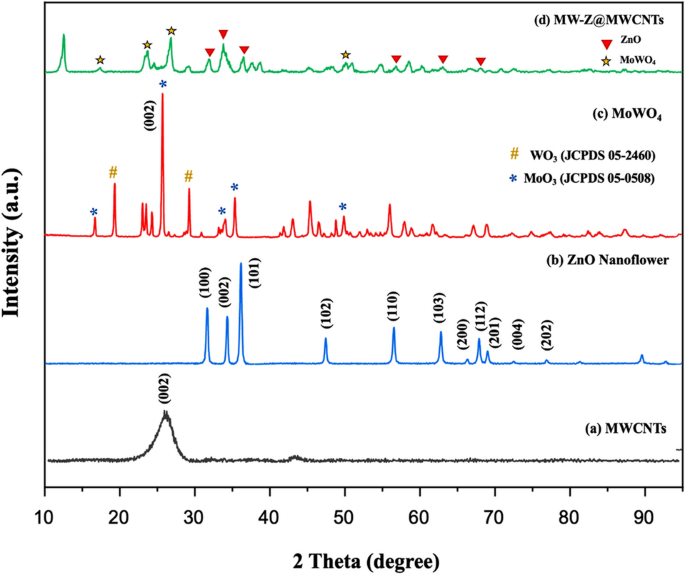
XRD patterns of (a) MWCNTs, (b) ZnO nanoflowers, (c) MoWO4, and (d) MW-Z@MWCNTs.
Morphological analysis
The morphology of MW-Z@MWCNTs was identified by FE-SEM and TEM. The morphology and particle size of MWCNTs are displayed in Fig. 3a,b. It is noticeable that MWCNTs consisted of octahedral-shaped overlapping small tubes of 20–30 µm size. It is clear from Fig. 3(c,d) that ZnO nanoflowers contained densely packed nanoneedles. These flower-like clusters were distributed across the surface substrate16. The morphology of MW-Z@MWCNTs is presented in Fig. 3(e,f). MW-Z@MWCNTs were found to be clumped together and possessed an indefinite morphology. The internal microstructural arrangement of the as-synthesized samples was determined by TEM (Fig. 4). It is noticeable from Fig. 4a,b that long MWCNTs with 5–50 nm external diameter overlapped each other. Furthermore, the formation of ZnO nanoflowers can be observed in Fig. 4(c,d). In a single nanoflower structure, petal spikes of 600–800 nm size were superficially directed and extended from the center of the flower. In comparison, MoWO4 had a relatively flatter morphology with a particle size of about 100 nm. Moreover, the black spots on MW-Z@MWCNTs indicate the attachment of ZnO nanoflowers and MoWO4 MWCNTs walls17.
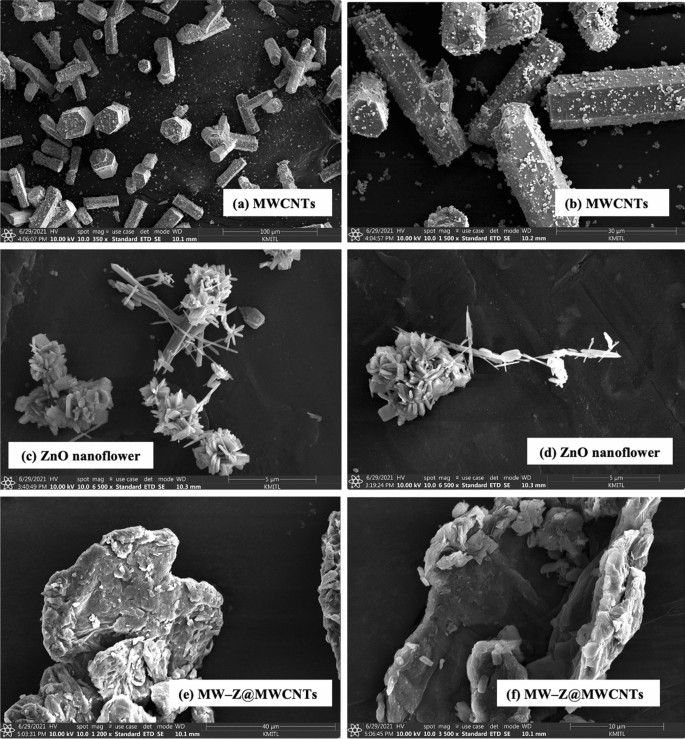
FE-SEM images of (a,b) MWCNTs, (c,d) ZnO nanoflowers, and (e,f) MW-Z@MWCNTs.
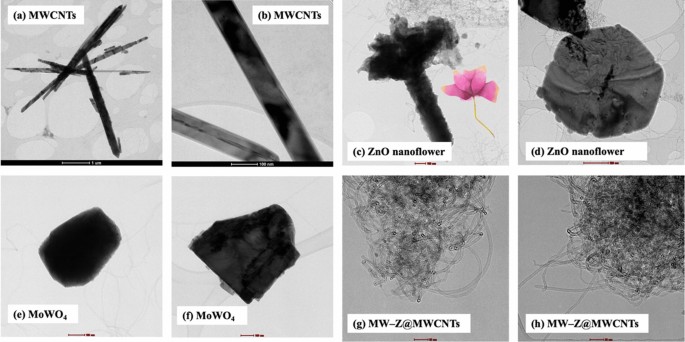
TEM images of (a,b) MWCNTs, (c,d) ZnO nanoflowers, (e,f) MoWO4, and (g,h) MW-Z@MWCNTs.
FTIR analysis
FTIR spectra in the wavenumber range of 400–4000 cm−1 were used to determine the chemical bonding state of ZnO nanoflowers, MoWO4, and MW-Z@MWCNTs (Fig. 5). In the spectrum of MoWO4, the bands at 811 cm−1 and 503 cm−1 appeared from the symmetrical vibration of Mo–W–O groups and the stretching vibration of Mo–O bonds, respectively. Moreover, the strong band at 620 cm−1 was formed due to the asymmetrical stretching vibration of W–O bonds in (W2O4)n chains18. In the spectrum of ZnO nanoflower, the characteristic band at 3412 cm−1 appeared from the stretching vibration of hydroxyl (OH) groups. The small peak around 1103 cm−1 could be assigned to the symmetric stretching of C–O–C bonds stretching mode. The deformation of OH groups occurred at 1401 cm−1. The peak around 1512 cm−1 could be attributed to the strong mode of vibration of C=O19. Moreover, the peaks around 695 cm−1 and 879 cm−1 appeared from the hexagonal phase of ZnO and the stretching vibration of C–O, respectively. In the spectrum of MW-Z@MWCNTs, the absorption bands at 3404 cm−1 and 1622 cm−1 appeared due to O–H bonding on the surface of MWCNTs. The peak at 892 cm−1 indicates the presence of O-C bonds in purified MWCNTs20.
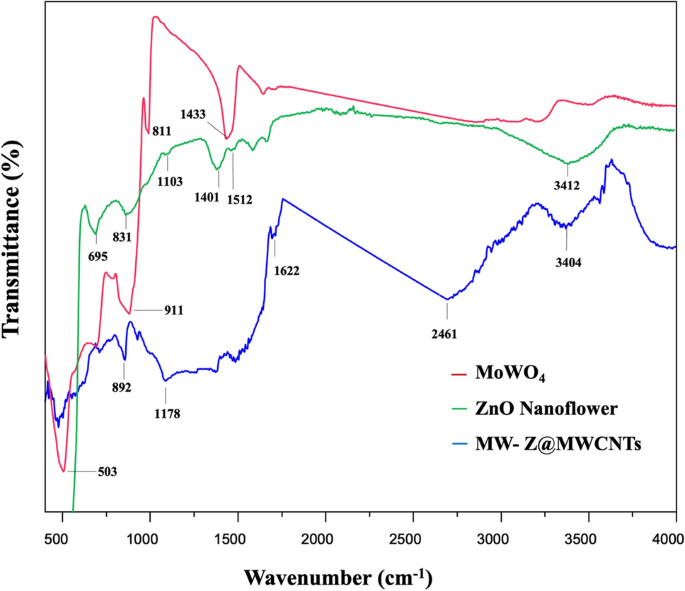
FTIR spectra of MoWO4, ZnO nanoflowers, and MW-Z@MWCNTs.
Raman spectroscopy
Raman spectroscopy was used to characterize intrinsic defects in ZnO nanoflowers, MoWO4, and MW-Z@MWCNTs (Fig. 6). The E2H–E2L and A1T modes at ∼331 and ∼380 cm−1, respectively, appeared from ZnO nanoflower crystals (line (a)). The peaks at ∼436 and ∼583 cm−1 could be assigned to the E2H and E1L phonon modes, respectively. The E2H mode represents a typical wurtzite crystal structure and reflects a perfect ZnO nanoflower crystal property. In addition, the centered peak of ZnO nanoflower at 569 cm‒1 and 1143 cm‒1 which corresponded to the first, second and third-order LO phonon bands of ZnO. To further obtain more information about structural and presence or absence of vibrational modes Raman spectra for MoWO4 shown in Fig. 6b, The Raman bands at 109 cm−1 and 225 cm−1 appeared from the A1g and E2g phonon modes and were related to the layered 2H phase of MoWO4. The Raman bands at 612, 702, 805 and 900 cm‒1 have been linked to the υ(O–W–O) stretching vibrational modes. In the Raman spectrum of MW-Z@MWCNTs, the peak at 1306 cm−1 corresponds to the defect (D) band (disorder-induced structures, tube ends, staging disorder), the peak at 1502 cm−1 corresponds to crystalline graphitic structures (G band), and the peak at 2728 cm−1 corresponds to the replica of the D band21,22.

Raman spectra of (a) ZnO nanoflowers, (b) MoWO4, and (c) MW-Z@MWCNTs.
XPS analysis
The XPS spectra of MW-Z@MWCNTs are displayed in Fig. 7. The presence of Mo, W, Zn, and O was well detected in MW-Z@MWCNTs (Fig. 7a). Figure 7b presents the high-resolution XPS spectrum of the Mo 3d peak. The binding energies of Mo 3d3/2 and Mo 3d5/2 were calculated as 235.0 eV and 231.5 eV, respectively, indicating the existence of Mo atoms in the + 4 oxidation state23. Moreover, the peaks at 531.4 eV and 533.1 eV could be assigned to oxygen atoms in MoWO4 (Fig. 7c). The spin–or-bit doublets at 35.6 eV, 37.6 eV, and 41.5 eV in the W 4f spectrum correspond to the W 4f7/2, W 4f5/2, and W 5p3/2 peaks, respectively, indicating the existence of W atoms in the + 6 oxidization state24. In Fig. 7e, the binding energies of 1021.70 eV and 1045.78 eV could be assigned to the Zn 2p3/2 and Zn 2p1/2 peaks, respectively.
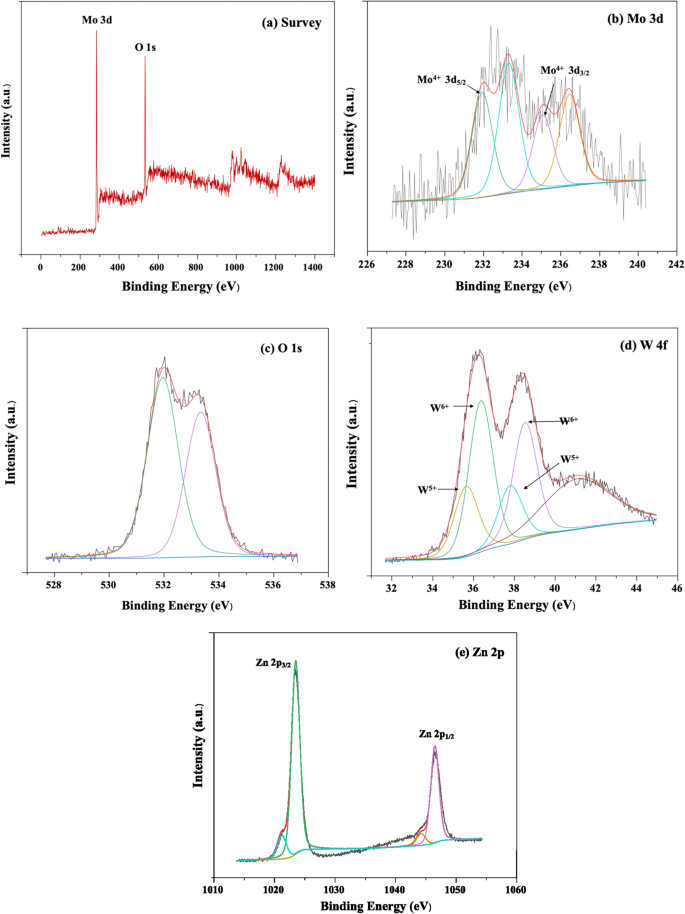
XPS spectra of (a) survey, (b) Mo 3d, (c) O1s, (d) W 4f, and (e) Zn 2p.
N2 adsorption–desorption isotherm (BET) analysis
N2 adsorption–desorption measurements were performed to measure the specific surface areas of MW-Z@MWCNTs (Fig. 8). In a typical BET analysis, a measure of the specific surface area (SSA) of MW-Z@MWCNTs is determined from the volume of N2 gas adsorbed on the MW-Z@MWCNTs. The basics Brunauer, Emmett, and Teller (BET) theory, the most common method used to describe the specific surface area followed the equation:
$$1/{text{W}}left( {left( {{text{P}}_{0} /{text{P}}} right) – {1}} right), = ,left( {{1}/{text{W}}_{{text{m}}} {text{C}}} right), + ,left( {{text{C}} – {1}/{text{W}}_{{text{m}}} {text{C}}} right)left( {{text{P}}/{text{P}}_{0} } right)$$
(1)
where W is the weight of gas adsorbed, P/P0 is the relative pressure, Wm is the weight of adsorbate as a monolayer, and C is the BET constant. Type II isothermals with H3 hysteresis could be attributed to the mesoporous structure of the samples25. Moreover, the large specific surface area (30.33 m2g–1) and pore size (about 30 nm) of MW-Z@MWCNTs significantly facilitated the access of the electrolyte and allowed rapid charge transfer kinetics to improve the power conversion efficiency of DSSC.
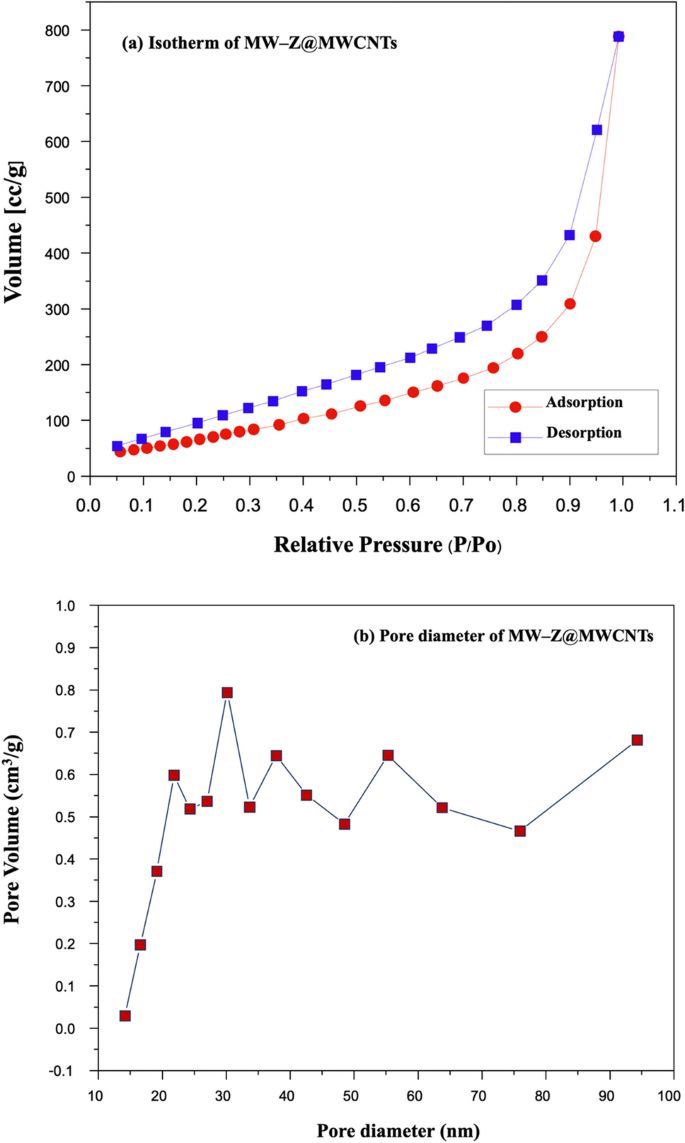
(a) Typical N2 adsorption–desorption isotherm and (b) pore size distribution curve of MW-Z@MWCNTs.
Photovoltaic study of DSSCs with different counter electrodes
The PCE values of different CEs for DSSC were calculated by a Class AAA solar simulator under AM 1.5G simulated sunlight (Fig. 9 and Table 1). The 1.5% MW-Z@MWCNTs CE yielded the highest power conversion efficiency of 9.96% with Voc = 0.78 V, Jsc = 19.16 mA/cm2, and FF = 0.66 followed by 1.0% MW-Z@MWCNTs (PCE = 8.19%) and 0.5% MW-Z@MWCNTs (PCE = 7.25%), which are greatly higher than those of traditional Pt CE, pure ZnO nanoflower CE, and MoWO4 CE under the same conditions. The higher PCE of MW-Z@MWCNTs could be attributed to the presence of ZnO nanoflowers and MoWO4 on MWCNTs, resulting in a large surface area and good charge electron transport capacity, which synergistically improved the electrocatalytic activity of the CE. In addition, the higher Voc of 1.5% MW-Z@MWCNTs could be ascribed to the efficient regeneration of the N719 dye with this CE, resulting in the generation of a greater number of excitons. The high surface area for adsorption capacity, the MWCNTs, and ZnO nanoflower result in an improvement in electron–hole pair production. Moreover, the enhanced performance is due to an improved conductive path between the MoWO4 nanoparticles by the addition of MWCNTs which displays remarkable catalytic activity in the reduction of I−326.
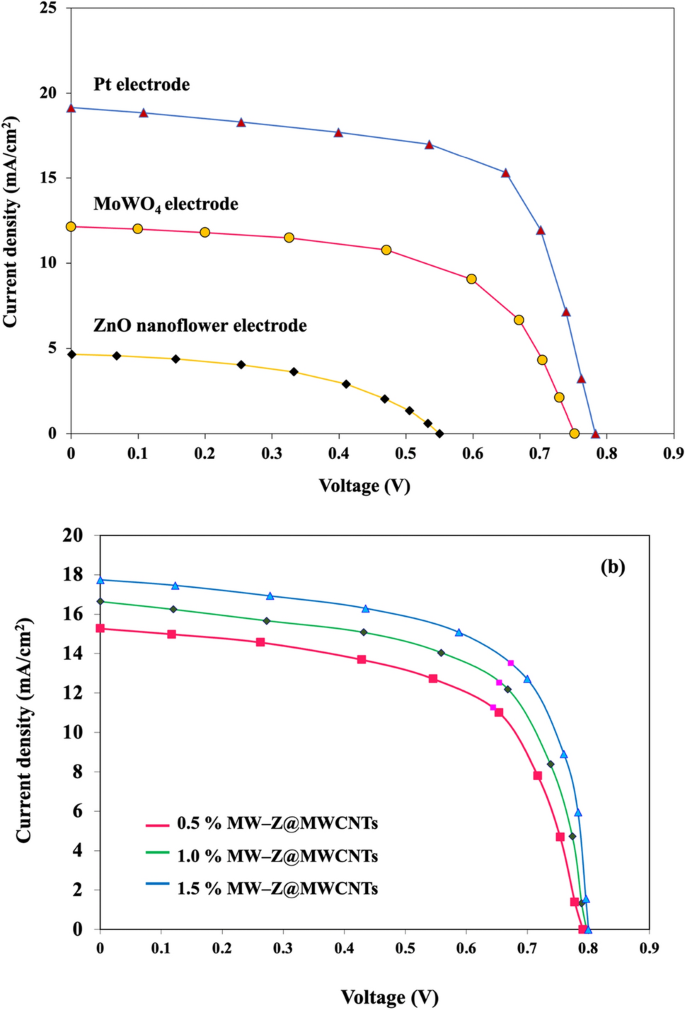
Current–voltage characteristics of DSSCs with different Ces.
Electrochemical impedance spectroscopy (EIS) analysis
The Nyquist plots of different CEs were measured to determine the ionic and electronic transport process of the DSSCs as shown in Fig. 10 and Table 1. Normally, two apparent semi-circles are detected in the Nyquist plots. The small arc at a high frequency is attributed to the resistance between the counter electrode and electrolyte mediator. The large arc at the mean frequency is associated with charge transfer resistance (Rct) at the interfaces of MW-Z@MWCNTs with electrolyte and dye molecules. The resistance element RS in the high-frequency region (> 105 Hz) is ascribed to the sheet resistance of the FTO substrates. Similar resistance for counter electrode (RCE), deduced from high-frequency semi-circle, implies that we used the Pt as a reference counter electrode by replacement of MW-Z@MWCNTs through our experiments. The Rct value of the 1.5% MW-Z@MWCNTs CE was lower than those of other electrodes. The Rct value increased greatly with the decrease of MWCNTs percentage because the addition of MWCNTs significantly improved the charge transfer capability of MW-Z@MWCNTs CE. Furthermore, the 1.5% MW-Z@MWCNTs CE enhanced the electrocatalytic effect of accessible and interconnected pores in ZnO nanoflowers and MWCNTs, allowing more efficient electron transfer between the electrode and the electrolyte to enhance the reduction reaction of the redox couple.
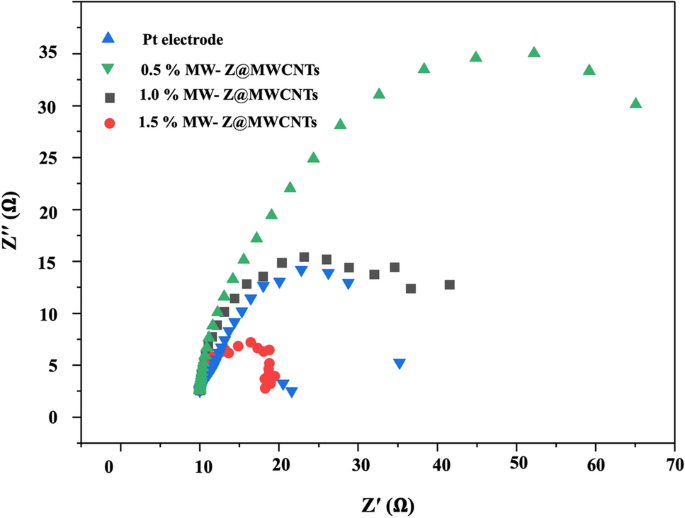
EIS analysis of the fabricated DSSCs with ZnO nanoflowers, MoWO4, and MW-Z@MWCNTs.
[ad_2]
Source link


