[ad_1]
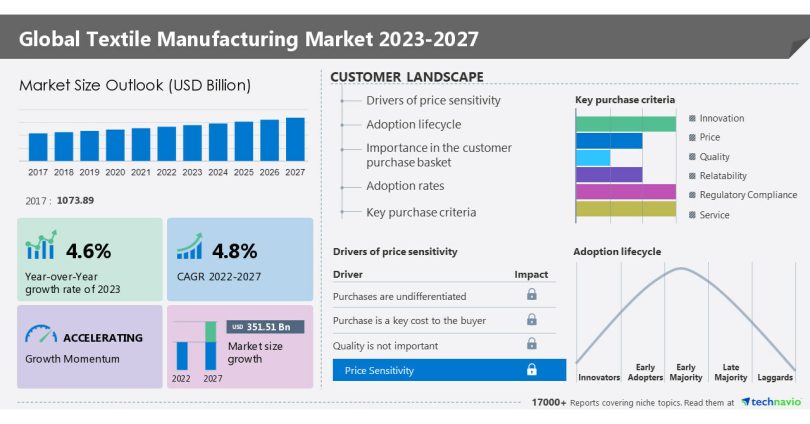
NEW YORK, Jan. 17, 2023 /PRNewswire/ — According to Technavio, the global textile manufacturing market size is estimated to grow by USD 351.51 billion from 2022 to 2027. The market is estimated to grow at a CAGR of 4.8% during the forecast period. APAC will account for 76% of the market’s growth during the forecast period.
For more Insights on market size Request a sample report

Global textile manufacturing market- Five forces
The global textile manufacturing market is fragmented, and the five forces analysis covers–
- Bargaining Power of Buyers
- The threat of New Entrants
- Threat of Rivalry
- Bargaining Power of Suppliers
- Threat of Substitutes
- Interpretation of porter’s five models helps to strategize the business, for entire details – buy the report!
Global textile manufacturing market – Customer landscape
The report includes the market’s adoption lifecycle, from the innovator’s stage to the laggard’s stage. It focuses on adoption rates in different regions based on penetration. Furthermore, the report also includes key purchase criteria and drivers of price sensitivity to help companies evaluate and develop their growth strategies.
Global textile manufacturing market – Segmentation assessment
Segment overview
Technavio has segmented the market based on type (natural fibers, polyesters, nylons, and others), application (fashion, technical, household, and others), and geography (APAC, North America, Europe, South America, and Middle East and Africa).
- The natural fibers segment will grow at the highest rate during the forecast period. Natural fibers are derived from plant and animal sources. The main categories of natural fibres are cotton, silk, linen, wool, hemp, and jute. These fibres are widely used to create clothes, accessories, furnishings, building materials, medical treatments, and automobile interiors. The market for natural fibres will grow with the rise of end-user industries, which will boost market growth during the forecast period.
Geography overview
By geography, the textile manufacturing market is segmented into APAC, North America, Europe, South America, and Middle East and Africa. The report provides actionable insights and estimates the contribution of all regions to the growth of the global textile manufacturing market.
- APAC will account for 76% of the market’s growth during the forecast period. The textile industry in APAC is boosted by the presence of numerous textile producers in China, India, Japan, Pakistan, South Korea, and Bangladesh. China has been the world’s largest consumer of textiles due to the increasing demand for textiles in the fashion and home furnishings industries. Hence it is expected that the expanding population, notably in China and India, will increase demand for textile manufacturing during the forecast period.
Download a Sample Report
Global textile manufacturing market – Market dynamics
Key factor driving market growth
- The premiumization through well-positioned brands is notably driving market growth.
- The market for high-end clothing and accessories, which includes tops, dresses, jackets, coats, jeans, and suits, is currently growing and is expected to do so in the upcoming years.
- Manufacturers of textiles in this industry have begun to concentrate on increasing their position in the luxury market to cover the entire range of garments.
- These factors are driving the demand for high-quality clothing, which will support the expansion of the global textile manufacturing market during the forecast period.
Leading trends influencing the market
- Increasing demand for textiles in the automotive industry is the primary trend in the market.
- The automotive industry includes the production of automotive parts such as composites, sound insulation, and vibration control used in interiors. Similarly, technical fabrics are used for seat belts, carpets, rugs, upholstery, and composite interior fixtures. Engine parts like hoses, belts, air filters, and fluid filters all use technical fabrics. This leads to an increase in the demand for textile in automotive industry which will further increase the production of textile around the world during the forecast period.
Major challenges hindering market growth
- Fluctuating crude oil prices are the major challenge in the market.
- Textile is categorized into two types, natural and synthetic. Polymers obtained from petroleum are used to create synthetic fabrics.
- Fluctuating crude oil prices have prompted suppliers to lower their pricing and encouraged vendors to take a variety of cost-cutting strategies, like reducing discretionary operational costs.
- Oil is the primary raw material used in the manufacturing of these polymers, hence their prices are influenced by oil prices. Changes in the market price of crude oil have a direct impact on polymer prices.
Driver, Trend & Challenges are the factor of market dynamics which states about consequences & sustainability of the businesses, find some insights from a sample report!
What are the key data covered in this textile manufacturing market report?
- CAGR of the market during the forecast period
- Detailed information on factors that will drive the growth of the textile manufacturing market between 2023 and 2027
- Precise estimation of the size of the textile manufacturing market and its contribution to the parent market
- Accurate predictions about upcoming trends and changes in consumer behavior
- Growth of the textile manufacturing market across APAC, North America, Europe, South America, and the Middle East and Africa
- A thorough analysis of the market’s competitive landscape and detailed information about vendors
- Comprehensive analysis of factors that will challenge the growth of textile manufacturing market vendors
Gain instant access to 17,000+ market research reports.
Technavio’s SUBSCRIPTION platform
Related Reports:
Smart Personal Protective Equipment Market by End-user, Product, Geography – Forecast and Analysis 2023-2027: The smart personal protective equipment (PPE) market is estimated to grow at a CAGR of 17.48% between 2022 and 2027. The size of the market is forecast to increase by USD 4,958.49 million. The risks of physical injuries in labor-intensive industries are notably driving market growth, although factors such as low consumer compliance may impede market growth.
Medical Textiles Market by Product, Application, and Geography – Forecast and Analysis 2023-2027: The medical textiles market is estimated to grow at a CAGR of 5.92% between 2022 and 2027. The size of the market is forecast to increase by USD 6,097.14 million. The growing elderly population is notably driving the market growth, although factors such as technical challenges and growing stringency of regulatory policies may impede the market growth.
|
Textile Manufacturing Market Scope |
|
|
Report Coverage |
Details |
|
Page number |
157 |
|
Base year |
2022 |
|
Historic period |
2017-2021 |
|
Forecast period |
2023-2027 |
|
Growth momentum & CAGR |
Accelerate at a CAGR of 4.8% |
|
Market growth 2023-2027 |
USD 351.51 billion |
|
Market structure |
Fragmented |
|
YoY growth 2022-2023 (%) |
4.6 |
|
Regional analysis |
APAC, North America, Europe, South America, and Middle East and Africa |
|
Performing market contribution |
APAC at 76% |
|
Key countries |
US, China, India, Pakistan, and Brazil |
|
Competitive landscape |
Leading Vendors, Market Positioning of Vendors, Competitive Strategies, and Industry Risks |
|
Key companies profiled |
B.C. Corp., BSL Ltd., China Petrochemical Corp., China Textiles (Shenzhen) Co. Ltd., Donear Industries Ltd., Far Eastern New Century Corp., Grasim Industries Ltd., Hyosung TNC, Industria de Diseno Textil SA, JCT Ltd., Koch Industries Inc., Li & Fung Ltd., Lu Thai Textile Co. Ltd., Modern Threads (India) Ltd., Nisshinbo Holdings Inc., Paramount Textile Mills (P) Ltd., Paulo de Oliveira, PVH Corp., Successori Reda SpA, and Toray Industries Inc. |
|
Market dynamics |
Parent Market Analysis; Market growth inducers and obstacles; Fast-growing and slow-growing segment analysis for the forecast period |
|
Customization purview |
If our report has not included the data that you are looking for, you can reach out to our analysts and get segments customized. |
|
Customization purview |
If our report has not included the data that you are looking for, you can reach out to our analysts and get segments customized. |
Browse for Technavio “Consumer Discretionary” Research Reports
Table of Contents
1 Executive Summary
- 1.1 Market overview
- Exhibit 01: Executive Summary – Chart on Market Overview
- Exhibit 02: Executive Summary – Data Table on Market Overview
- Exhibit 03: Executive Summary – Chart on Global Market Characteristics
- Exhibit 04: Executive Summary – Chart on Market by Geography
- Exhibit 05: Executive Summary – Chart on Market Segmentation by Type
- Exhibit 06: Executive Summary – Chart on Market Segmentation by Application
- Exhibit 07: Executive Summary – Chart on Incremental Growth
- Exhibit 08: Executive Summary – Data Table on Incremental Growth
- Exhibit 09: Executive Summary – Chart on Vendor Market Positioning
2 Market Landscape
- 2.1 Market ecosystem
- Exhibit 10: Parent market
- Exhibit 11: Market Characteristics
3 Market Sizing
- 3.1 Market definition
- Exhibit 12: Offerings of vendors included in the market definition
- 3.2 Market segment analysis
- Exhibit 13: Market segments
- 3.4 Market outlook: Forecast for 2022-2027
- Exhibit 14: Chart on Global – Market size and forecast 2022-2027 ($ billion)
- Exhibit 15: Data Table on Global – Market size and forecast 2022-2027 ($ billion)
- Exhibit 16: Chart on Global Market: Year-over-year growth 2022-2027 (%)
- Exhibit 17: Data Table on Global Market: Year-over-year growth 2022-2027 (%)
4 Historic Market Size
- 4.1 Global textile manufacturing market 2017 – 2021
- Exhibit 18: Historic Market Size – Data Table on Global textile manufacturing market 2017 – 2021 ($ billion)
- 4.2 Type Segment Analysis 2017 – 2021
- Exhibit 19: Historic Market Size – Type Segment 2017 – 2021 ($ billion)
- 4.3 Application Segment Analysis 2017 – 2021
- Exhibit 20: Historic Market Size – Application Segment 2017 – 2021 ($ billion)
- 4.4 Geography Segment Analysis 2017 – 2021
- Exhibit 21: Historic Market Size – Geography Segment 2017 – 2021 ($ billion)
- 4.5 Country Segment Analysis 2017 – 2021
- Exhibit 22: Historic Market Size – Country Segment 2017 – 2021 ($ billion)
5 Five Forces Analysis
- 5.1 Five forces summary
- Exhibit 23: Five forces analysis – Comparison between 2022 and 2027
- 5.2 Bargaining power of buyers
- Exhibit 24: Chart on Bargaining power of buyers – Impact of key factors 2022 and 2027
- 5.3 Bargaining power of suppliers
- Exhibit 25: Bargaining power of suppliers – Impact of key factors in 2022 and 2027
- 5.4 Threat of new entrants
- Exhibit 26: Threat of new entrants – Impact of key factors in 2022 and 2027
- 5.5 Threat of substitutes
- Exhibit 27: Threat of substitutes – Impact of key factors in 2022 and 2027
- 5.6 Threat of rivalry
- Exhibit 28: Threat of rivalry – Impact of key factors in 2022 and 2027
- 5.7 Market condition
- Exhibit 29: Chart on Market condition – Five forces 2022 and 2027
6 Market Segmentation by Type
- 6.1 Market segments
- Exhibit 30: Chart on Type – Market share 2022-2027 (%)
- Exhibit 31: Data Table on Type – Market share 2022-2027 (%)
- 6.2 Comparison by Type
- Exhibit 32: Chart on Comparison by Type
- Exhibit 33: Data Table on Comparison by Type
- 6.3 Natural fibers – Market size and forecast 2022-2027
- Exhibit 34: Chart on Natural fibers – Market size and forecast 2022-2027 ($ billion)
- Exhibit 35: Data Table on Natural fibers – Market size and forecast 2022-2027 ($ billion)
- Exhibit 36: Chart on Natural fibers – Year-over-year growth 2022-2027 (%)
- Exhibit 37: Data Table on Natural fibers – Year-over-year growth 2022-2027 (%)
- 6.4 Polyesters – Market size and forecast 2022-2027
- Exhibit 38: Chart on Polyesters – Market size and forecast 2022-2027 ($ billion)
- Exhibit 39: Data Table on Polyesters – Market size and forecast 2022-2027 ($ billion)
- Exhibit 40: Chart on Polyesters – Year-over-year growth 2022-2027 (%)
- Exhibit 41: Data Table on Polyesters – Year-over-year growth 2022-2027 (%)
- 6.5 Nylons – Market size and forecast 2022-2027
- Exhibit 42: Chart on Nylons – Market size and forecast 2022-2027 ($ billion)
- Exhibit 43: Data Table on Nylons – Market size and forecast 2022-2027 ($ billion)
- Exhibit 44: Chart on Nylons – Year-over-year growth 2022-2027 (%)
- Exhibit 45: Data Table on Nylons – Year-over-year growth 2022-2027 (%)
- 6.6 Others – Market size and forecast 2022-2027
- Exhibit 46: Chart on Others – Market size and forecast 2022-2027 ($ billion)
- Exhibit 47: Data Table on Others – Market size and forecast 2022-2027 ($ billion)
- Exhibit 48: Chart on Others – Year-over-year growth 2022-2027 (%)
- Exhibit 49: Data Table on Others – Year-over-year growth 2022-2027 (%)
- 6.7 Market opportunity by Type
- Exhibit 50: Market opportunity by Type ($ billion)
7 Market Segmentation by Application
- 7.1 Market segments
- Exhibit 51: Chart on Application – Market share 2022-2027 (%)
- Exhibit 52: Data Table on Application – Market share 2022-2027 (%)
- 7.2 Comparison by Application
- Exhibit 53: Chart on Comparison by Application
- Exhibit 54: Data Table on Comparison by Application
- 7.3 Fashion – Market size and forecast 2022-2027
- Exhibit 55: Chart on Fashion – Market size and forecast 2022-2027 ($ billion)
- Exhibit 56: Data Table on Fashion – Market size and forecast 2022-2027 ($ billion)
- Exhibit 57: Chart on Fashion – Year-over-year growth 2022-2027 (%)
- Exhibit 58: Data Table on Fashion – Year-over-year growth 2022-2027 (%)
- 7.4 Technical – Market size and forecast 2022-2027
- Exhibit 59: Chart on Technical – Market size and forecast 2022-2027 ($ billion)
- Exhibit 60: Data Table on Technical – Market size and forecast 2022-2027 ($ billion)
- Exhibit 61: Chart on Technical – Year-over-year growth 2022-2027 (%)
- Exhibit 62: Data Table on Technical – Year-over-year growth 2022-2027 (%)
- 7.5 Household – Market size and forecast 2022-2027
- Exhibit 63: Chart on Household – Market size and forecast 2022-2027 ($ billion)
- Exhibit 64: Data Table on Household – Market size and forecast 2022-2027 ($ billion)
- Exhibit 65: Chart on Household – Year-over-year growth 2022-2027 (%)
- Exhibit 66: Data Table on Household – Year-over-year growth 2022-2027 (%)
- 7.6 Others – Market size and forecast 2022-2027
- Exhibit 67: Chart on Others – Market size and forecast 2022-2027 ($ billion)
- Exhibit 68: Data Table on Others – Market size and forecast 2022-2027 ($ billion)
- Exhibit 69: Chart on Others – Year-over-year growth 2022-2027 (%)
- Exhibit 70: Data Table on Others – Year-over-year growth 2022-2027 (%)
- 7.7 Market opportunity by Application
- Exhibit 71: Market opportunity by Application ($ billion)
8 Customer Landscape
- 8.1 Customer landscape overview
- Exhibit 72: Analysis of price sensitivity, lifecycle, customer purchase basket, adoption rates, and purchase criteria
9 Geographic Landscape
- 9.1 Geographic segmentation
- Exhibit 73: Chart on Market share by geography 2022-2027 (%)
- Exhibit 74: Data Table on Market share by geography 2022-2027 (%)
- 9.2 Geographic comparison
- Exhibit 75: Chart on Geographic comparison
- Exhibit 76: Data Table on Geographic comparison
- 9.3 APAC – Market size and forecast 2022-2027
- Exhibit 77: Chart on APAC – Market size and forecast 2022-2027 ($ billion)
- Exhibit 78: Data Table on APAC – Market size and forecast 2022-2027 ($ billion)
- Exhibit 79: Chart on APAC – Year-over-year growth 2022-2027 (%)
- Exhibit 80: Data Table on APAC – Year-over-year growth 2022-2027 (%)
- 9.4 North America – Market size and forecast 2022-2027
- Exhibit 81: Chart on North America – Market size and forecast 2022-2027 ($ billion)
- Exhibit 82: Data Table on North America – Market size and forecast 2022-2027 ($ billion)
- Exhibit 83: Chart on North America – Year-over-year growth 2022-2027 (%)
- Exhibit 84: Data Table on North America – Year-over-year growth 2022-2027 (%)
- 9.5 Europe – Market size and forecast 2022-2027
- Exhibit 85: Chart on Europe – Market size and forecast 2022-2027 ($ billion)
- Exhibit 86: Data Table on Europe – Market size and forecast 2022-2027 ($ billion)
- Exhibit 87: Chart on Europe – Year-over-year growth 2022-2027 (%)
- Exhibit 88: Data Table on Europe – Year-over-year growth 2022-2027 (%)
- 9.6 South America – Market size and forecast 2022-2027
- Exhibit 89: Chart on South America – Market size and forecast 2022-2027 ($ billion)
- Exhibit 90: Data Table on South America – Market size and forecast 2022-2027 ($ billion)
- Exhibit 91: Chart on South America – Year-over-year growth 2022-2027 (%)
- Exhibit 92: Data Table on South America – Year-over-year growth 2022-2027 (%)
- 9.7 Middle East and Africa – Market size and forecast 2022-2027
- Exhibit 93: Chart on Middle East and Africa – Market size and forecast 2022-2027 ($ billion)
- Exhibit 94: Data Table on Middle East and Africa – Market size and forecast 2022-2027 ($ billion)
- Exhibit 95: Chart on Middle East and Africa – Year-over-year growth 2022-2027 (%)
- Exhibit 96: Data Table on Middle East and Africa – Year-over-year growth 2022-2027 (%)
- 9.8 China – Market size and forecast 2022-2027
- Exhibit 97: Chart on China – Market size and forecast 2022-2027 ($ billion)
- Exhibit 98: Data Table on China – Market size and forecast 2022-2027 ($ billion)
- Exhibit 99: Chart on China – Year-over-year growth 2022-2027 (%)
- Exhibit 100: Data Table on China – Year-over-year growth 2022-2027 (%)
- 9.9 India – Market size and forecast 2022-2027
- Exhibit 101: Chart on India – Market size and forecast 2022-2027 ($ billion)
- Exhibit 102: Data Table on India – Market size and forecast 2022-2027 ($ billion)
- Exhibit 103: Chart on India – Year-over-year growth 2022-2027 (%)
- Exhibit 104: Data Table on India – Year-over-year growth 2022-2027 (%)
- 9.10 US – Market size and forecast 2022-2027
- Exhibit 105: Chart on US – Market size and forecast 2022-2027 ($ billion)
- Exhibit 106: Data Table on US – Market size and forecast 2022-2027 ($ billion)
- Exhibit 107: Chart on US – Year-over-year growth 2022-2027 (%)
- Exhibit 108: Data Table on US – Year-over-year growth 2022-2027 (%)
- 9.11 Brazil – Market size and forecast 2022-2027
- Exhibit 109: Chart on Brazil – Market size and forecast 2022-2027 ($ billion)
- Exhibit 110: Data Table on Brazil – Market size and forecast 2022-2027 ($ billion)
- Exhibit 111: Chart on Brazil – Year-over-year growth 2022-2027 (%)
- Exhibit 112: Data Table on Brazil – Year-over-year growth 2022-2027 (%)
- 9.12 Pakistan – Market size and forecast 2022-2027
- Exhibit 113: Chart on Pakistan – Market size and forecast 2022-2027 ($ billion)
- Exhibit 114: Data Table on Pakistan – Market size and forecast 2022-2027 ($ billion)
- Exhibit 115: Chart on Pakistan – Year-over-year growth 2022-2027 (%)
- Exhibit 116: Data Table on Pakistan – Year-over-year growth 2022-2027 (%)
- 9.13 Market opportunity by geography
- Exhibit 117: Market opportunity by geography ($ billion)
10 Drivers, Challenges, and Trends
- 10.3 Impact of drivers and challenges
- Exhibit 118: Impact of drivers and challenges in 2022 and 2027
11 Vendor Landscape
- 11.2 Vendor landscape
- Exhibit 119: Overview on Criticality of inputs and Factors of differentiation
- 11.3 Landscape disruption
- Exhibit 120: Overview on factors of disruption
- 11.4 Industry risks
- Exhibit 121: Impact of key risks on business
12 Vendor Analysis
- 12.1 Vendors covered
- Exhibit 122: Vendors covered
- 12.2 Market positioning of vendors
- Exhibit 123: Matrix on vendor position and classification
- 12.3 B.C. Corp.
- Exhibit 124: B.C. Corp. – Overview
- Exhibit 125: B.C. Corp. – Product / Service
- Exhibit 126: B.C. Corp. – Key offerings
- 12.4 BSL Ltd.
- Exhibit 127: BSL Ltd. – Overview
- Exhibit 128: BSL Ltd. – Business segments
- Exhibit 129: BSL Ltd. – Key offerings
- Exhibit 130: BSL Ltd. – Segment focus
- 12.5 China Petrochemical Corp.
- Exhibit 131: China Petrochemical Corp. – Overview
- Exhibit 132: China Petrochemical Corp. – Business segments
- Exhibit 133: China Petrochemical Corp. – Key offerings
- Exhibit 134: China Petrochemical Corp. – Segment focus
- 12.6 China Textiles (Shenzhen) Co. Ltd.
- Exhibit 135: China Textiles (Shenzhen) Co. Ltd. – Overview
- Exhibit 136: China Textiles (Shenzhen) Co. Ltd. – Product / Service
- Exhibit 137: China Textiles (Shenzhen) Co. Ltd. – Key offerings
- 12.7 Donear Industries Ltd.
- Exhibit 138: Donear Industries Ltd. – Overview
- Exhibit 139: Donear Industries Ltd. – Business segments
- Exhibit 140: Donear Industries Ltd. – Key offerings
- Exhibit 141: Donear Industries Ltd. – Segment focus
- 12.8 Industria de Diseno Textil SA
- Exhibit 142: Industria de Diseno Textil SA – Overview
- Exhibit 143: Industria de Diseno Textil SA – Business segments
- Exhibit 144: Industria de Diseno Textil SA – Key offerings
- Exhibit 145: Industria de Diseno Textil SA – Segment focus
- 12.9 JCT Ltd.
- Exhibit 146: JCT Ltd. – Overview
- Exhibit 147: JCT Ltd. – Product / Service
- Exhibit 148: JCT Ltd. – Key offerings
- 12.10 Koch Industries Inc.
- Exhibit 149: Koch Industries Inc. – Overview
- Exhibit 150: Koch Industries Inc. – Product / Service
- Exhibit 151: Koch Industries Inc. – Key news
- Exhibit 152: Koch Industries Inc. – Key offerings
- 12.11 Li Fung Ltd.
- Exhibit 153: Li Fung Ltd. – Overview
- Exhibit 154: Li Fung Ltd. – Product / Service
- Exhibit 155: Li Fung Ltd. – Key offerings
- 12.12 Lu Thai Textile Co. Ltd.
- Exhibit 156: Lu Thai Textile Co. Ltd. – Overview
- Exhibit 157: Lu Thai Textile Co. Ltd. – Product / Service
- Exhibit 158: Lu Thai Textile Co. Ltd. – Key offerings
- 12.13 Modern Threads (India) Ltd.
- Exhibit 159: Modern Threads (India) Ltd. – Overview
- Exhibit 160: Modern Threads (India) Ltd. – Business segments
- Exhibit 161: Modern Threads (India) Ltd. – Key offerings
- Exhibit 162: Modern Threads (India) Ltd. – Segment focus
- 12.14 Paramount Textile Mills (P) Ltd.
- Exhibit 163: Paramount Textile Mills (P) Ltd. – Overview
- Exhibit 164: Paramount Textile Mills (P) Ltd. – Product / Service
- Exhibit 165: Paramount Textile Mills (P) Ltd. – Key offerings
- 12.15 Paulo de Oliveira
- Exhibit 166: Paulo de Oliveira – Overview
- Exhibit 167: Paulo de Oliveira – Product / Service
- Exhibit 168: Paulo de Oliveira – Key offerings
- 12.16 Successori Reda SpA
- Exhibit 169: Successori Reda SpA – Overview
- Exhibit 170: Successori Reda SpA – Product / Service
- Exhibit 171: Successori Reda SpA – Key offerings
- 12.17 Toray Industries Inc.
- Exhibit 172: Toray Industries Inc. – Overview
- Exhibit 173: Toray Industries Inc. – Business segments
- Exhibit 174: Toray Industries Inc. – Key news
- Exhibit 175: Toray Industries Inc. – Key offerings
- Exhibit 176: Toray Industries Inc. – Segment focus
13 Appendix
- 13.2 Inclusions and exclusions checklist
- Exhibit 177: Inclusions checklist
- Exhibit 178: Exclusions checklist
- 13.3 Currency conversion rates for US$
- Exhibit 179: Currency conversion rates for US$
- 13.4 Research methodology
- Exhibit 180: Research methodology
- Exhibit 181: Validation techniques employed for market sizing
- Exhibit 182: Information sources
- 13.5 List of abbreviations
- Exhibit 183: List of abbreviations
About Us
Technavio is a leading global technology research and advisory company. Their research and analysis focuses on emerging market trends and provides actionable insights to help businesses identify market opportunities and develop effective strategies to optimize their market positions. With over 500 specialized analysts, Technavio’s report library consists of more than 17,000 reports and counting, covering 800 technologies, spanning across 50 countries. Their client base consists of enterprises of all sizes, including more than 100 Fortune 500 companies. This growing client base relies on Technavio’s comprehensive coverage, extensive research, and actionable market insights to identify opportunities in existing and potential markets and assess their competitive positions within changing market scenarios.
Contact
Technavio Research
Jesse Maida
Media & Marketing Executive
US: +1 844 364 1100
UK: +44 203 893 3200
Email: [email protected]
Website: www.technavio.com/
SOURCE Technavio

[ad_2]
Source link


