[ad_1]
This review of farmers’ crop insurance choices suggests offering another farm-level product: Yield Protection (YP) with the harvest price option (HPO). YP-HPO would value shortfalls in yield at the higher of the projected or harvest insurance price. The current YP product uses only the projected price. Offering YP-HPO would create symmetry in product offering. Yield insurance could be purchased with and without HPO just as revenue insurance can now be purchased with and without HPO. Farmers would be able to choose if they want price loss protection with HPO. Situations exist when a farmer may not want price loss protection but would want HPO.
Overview and Methodology
YP-HPO would be a relatively easy contract to offer. It would also create symmetry among revenue and yield individual farm insurance products:
RP and RP-HPE, the current revenue products, cover individual farm loss from yield and price declines. RP-HPE uses the projected price to calculate insured liability and insured loss. RP uses HPO, or the higher of projected or harvest insurance price, to calculate insured liability and insured loss. When insurance price is higher at harvest, the harvest price is used to value both the insured liability and harvest revenue. Revenue can thus decline only if yield declines, with the yield decline valued at the higher harvest price.
YP, the current yield product, covers individual farm yield loss. Insured value and loss are calculated using the projected price. No HPO yield product exists.
RP, RP-HPE, and YP were first offered in the 2011 crop year. Their features had been available in earlier products but the 2011 set was simplified and integrated. Insured acres of barley, corn, cotton, rice, sorghum, soybeans, and wheat are examined. Each crop had at least one million insured acres every year from 2011 through 2021, the last crop year with nearly complete data. Other primary crop insurance products elected by farmers for the seven crops since 2011 include Area Revenue Protection (ARP), Area Revenue Protection – Harvest Price Exclusion (ARP-HPE), Area Yield Protection (AYP), Margin Protection (MP), and Stacked Income Protection Plan – Revenue Protection (STAX-RP). These other products accounted for a combined 2.2% of insured acres in 2011, declining to 0.6% in 2021. County companion add-on products, such as Supplemental Coverage Option (SCO) and Enhanced Coverage Option (ECO), are not covered in this analysis. The data in this analysis are from the Risk Management Agency’s (RMA) “Summary of Business” file.
RP (Revenue Protection)
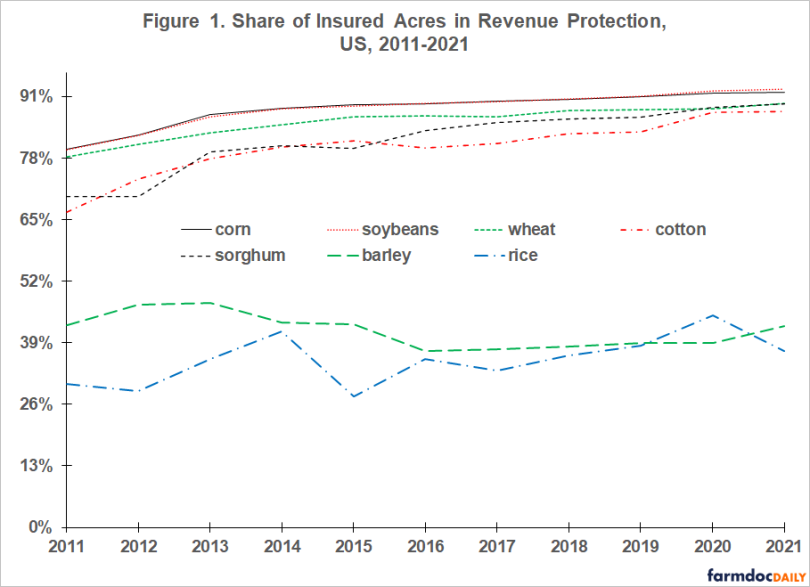
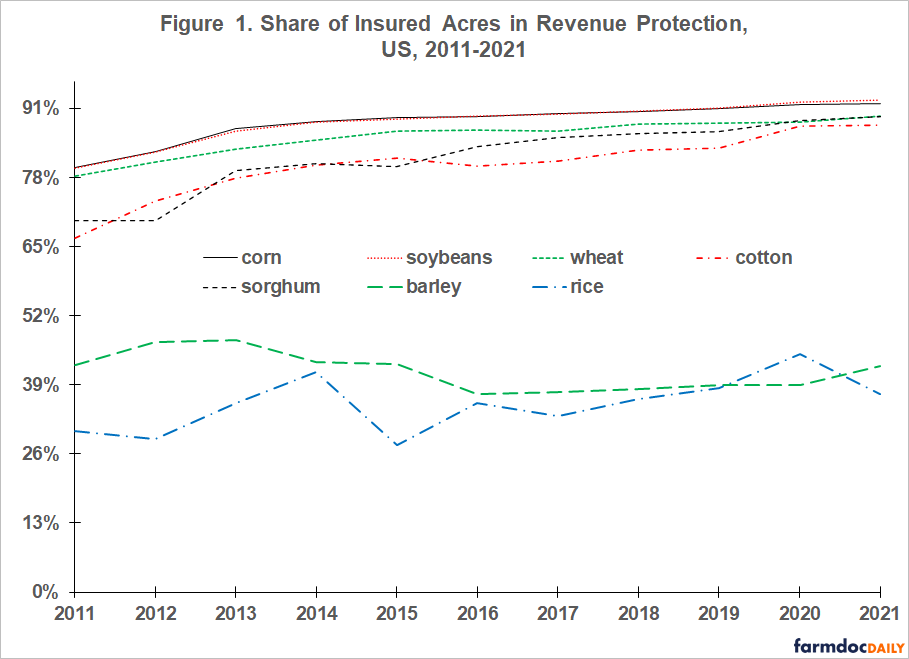
Two groups of crops exist. Corn, cotton, sorghum, soybean, and wheat clearly favor RP and its dominance has grown. In 2011, RP’s share of total insured acres ranged from 67% for cotton to 80% for corn and soybeans (see Figure 1). By 2021, RP’s share ranged from 88% for cotton to 93% for soybeans. In contrast, RP’s share has never reached 50% for barley and rice.
YP (Yield Protection)
The same two groups of crops exist for YP. For barley and rice, YP was the most used insurance product each year (see Figure 2). Average share for the 11 years was 58% for barley and 63% for rice. No trend exists for rice. Barley’s trend is slightly up.
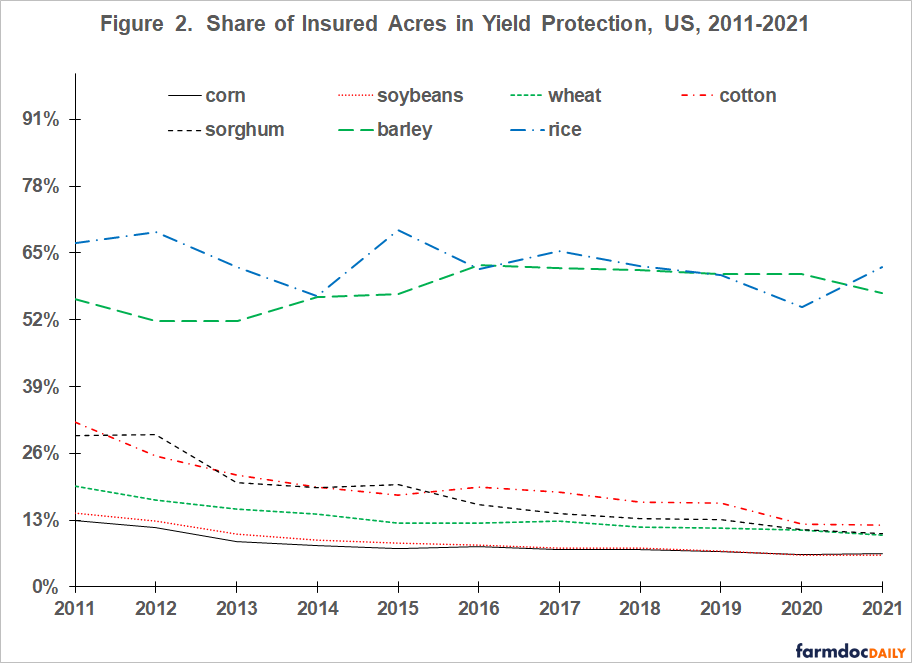
For corn, cotton, sorghum, soybean, and wheat, YP’s share was smaller and has declined. For the five crops as a group, YP’s average share was 9% in 2021vs. 22% in 2011. Highest share was 12% in 2021 vs. 32% in 2011, both for cotton.
RP-HPE (Revenue Protection without HPO)
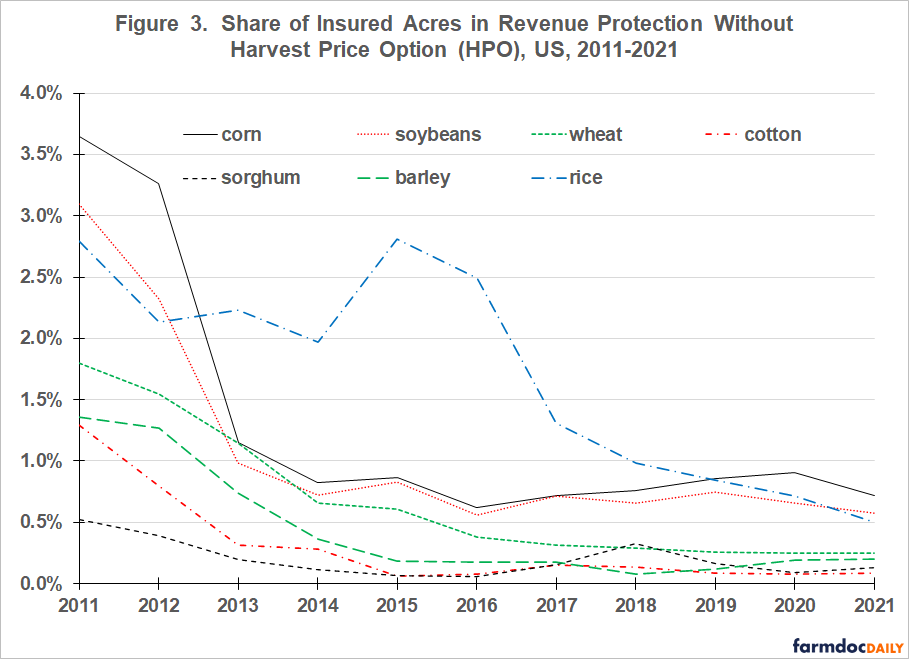
Little distinction exists across the seven crops. RP-HPE’s share was very low in 2011, declining since. Highest share was 0.7% in 2021 vs. 3.6% in 2011, both for corn.
Summary Observations
US farmers clearly prefer individual farm insurance products.
Among individual farm insurance products, RP and YP are preferred but their rank order varies by crop. For the crops examined in this article, RP is preferred for five while YP is preferred for two.
Among the two revenue products, farmers clearly prefer HPO. Use of revenue protection without HPO (RP-HPE) is minuscule.
HPO is a yield loss valuation option. HPO results in the higher of the projected or harvest insurance price being used to determine the insured liability and thus indemnities. If harvest price is higher, both the insured liability and value of production at harvest are determined using the harvest price. Thus, there is no price loss, implying an indemnity will be paid only if yield loss exceeds the deductible.
Current YP users may prefer to have the option to use HPO to value their yield losses. However, coverage levels are notably lower for yield than revenue insurance. For example, for 2021 corn, average coverage level was 63% for YP vs. 77% for revenue products (RMA, Summary of Business). This relationship suggests premium cost is an important consideration for farmers who buy yield insurance, implying they may be unwilling to pay the higher premium associated with HPO.
Current RP users have the option to buy HPO but do not have an option to buy price loss coverage. Both revenue products have price loss coverage. A current RP user may prefer not to have price loss coverage if they believe the risk of price loss is minimal but may prefer HPO coverage if they believe the probability of price increase is notable. Offering YP-HPO would give them this product option.
An RP user may believe the risk of price loss is adequately covered otherwise. For example, a farmer may conclude that the Price Loss Coverage (PLC) commodity program provides adequate price loss coverage when market prices are below the reference price. The 2018 farm bill further increases the possibility of this situation since commodity program sign up was authorized for every year instead of being for the life of the farm bill.
An RP user may believe that private market forward price contracts can be used to manage the risk of price loss more cheaply than current revenue products. Forward price contracts usually have no monetary transaction cost. In contrast, the farmdoc daily article of September 14, 2022 found that price loss accounts for 11% to 17% of indemnities paid by current revenue insurance products. Premiums should thus be lower by approximately this amount for YP-HPO than RP.
In summary, it is not clear if YP-HPO would be a successful insurance product, but situations exists in which offering YP-HPO may provide a more optimal set of risk management options for farmers. The only way to find out if YP-HPO would be successful is to offer it.
References and Data Sources
US Department of Agriculture, Risk Management Agency. August 2022. Summary of Business. https://www.rma.usda.gov/SummaryOfBusiness
Zulauf, C., K. Swanson, G. Schnitkey and N. Paulson. “Decomposing Crop Revenue Insurance Indemnities into Type of Loss Covered.” farmdoc daily (12):141, Department of Agricultural and Consumer Economics, University of Illinois at Urbana-Champaign, September 14, 2022.
[ad_2]
Source link


