
[ad_1]
The last three months have been tough on Royale Home Holdings Limited (HKG:1198) shareholders, who have seen the share price decline a rather worrying 47%. But that scarcely detracts from the really solid long term returns generated by the company over five years. Indeed, the share price is up an impressive 113% in that time. Generally speaking the long term returns will give you a better idea of business quality than short periods can. Of course, that doesn’t necessarily mean it’s cheap now.
In light of the stock dropping 12% in the past week, we want to investigate the longer term story, and see if fundamentals have been the driver of the company’s positive five-year return.
Check out the opportunities and risks within the HK Consumer Durables industry.
While markets are a powerful pricing mechanism, share prices reflect investor sentiment, not just underlying business performance. One flawed but reasonable way to assess how sentiment around a company has changed is to compare the earnings per share (EPS) with the share price.
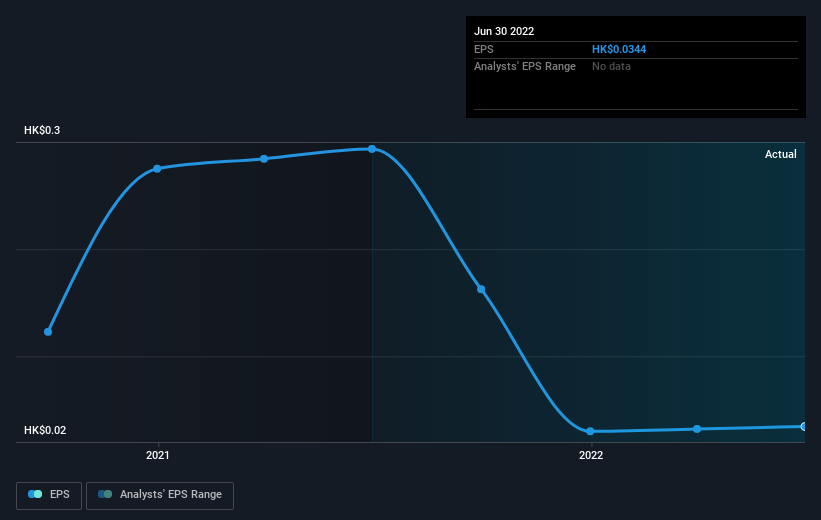
During five years of share price growth, Royale Home Holdings achieved compound earnings per share (EPS) growth of 5.2% per year. This EPS growth is lower than the 16% average annual increase in the share price. So it’s fair to assume the market has a higher opinion of the business than it did five years ago. And that’s hardly shocking given the track record of growth.
The graphic below depicts how EPS has changed over time (unveil the exact values by clicking on the image).
It’s probably worth noting that the CEO is paid less than the median at similar sized companies. But while CEO remuneration is always worth checking, the really important question is whether the company can grow earnings going forward. It might be well worthwhile taking a look at our free report on Royale Home Holdings’ earnings, revenue and cash flow.
What About Dividends?
As well as measuring the share price return, investors should also consider the total shareholder return (TSR). The TSR incorporates the value of any spin-offs or discounted capital raisings, along with any dividends, based on the assumption that the dividends are reinvested. So for companies that pay a generous dividend, the TSR is often a lot higher than the share price return. We note that for Royale Home Holdings the TSR over the last 5 years was 128%, which is better than the share price return mentioned above. This is largely a result of its dividend payments!
A Different Perspective
We regret to report that Royale Home Holdings shareholders are down 43% for the year (even including dividends). Unfortunately, that’s worse than the broader market decline of 18%. However, it could simply be that the share price has been impacted by broader market jitters. It might be worth keeping an eye on the fundamentals, in case there’s a good opportunity. Longer term investors wouldn’t be so upset, since they would have made 18%, each year, over five years. It could be that the recent sell-off is an opportunity, so it may be worth checking the fundamental data for signs of a long term growth trend. I find it very interesting to look at share price over the long term as a proxy for business performance. But to truly gain insight, we need to consider other information, too. For instance, we’ve identified 4 warning signs for Royale Home Holdings (1 is potentially serious) that you should be aware of.
If you are like me, then you will not want to miss this free list of growing companies that insiders are buying.
Please note, the market returns quoted in this article reflect the market weighted average returns of stocks that currently trade on HK exchanges.
Valuation is complex, but we’re helping make it simple.
Find out whether Royale Home Holdings is potentially over or undervalued by checking out our comprehensive analysis, which includes fair value estimates, risks and warnings, dividends, insider transactions and financial health.
View the Free Analysis
Have feedback on this article? Concerned about the content? Get in touch with us directly. Alternatively, email editorial-team (at) simplywallst.com.
This article by Simply Wall St is general in nature. We provide commentary based on historical data and analyst forecasts only using an unbiased methodology and our articles are not intended to be financial advice. It does not constitute a recommendation to buy or sell any stock, and does not take account of your objectives, or your financial situation. We aim to bring you long-term focused analysis driven by fundamental data. Note that our analysis may not factor in the latest price-sensitive company announcements or qualitative material. Simply Wall St has no position in any stocks mentioned.
[ad_2]
Source link


