
[ad_1]
ssucsy
Introduction
The Canadian company Wheaton Precious Metals (NYSE:WPM) released its third-quarter 2022 results on November 3, 2022.
Note: This article updates my previous article published on August 16, 2022. I have been following WPM quarterly results since Sep. 2018.
WPM has 21 operating mines and 13 development projects throughout the Americas.
WPM Assets location in 3Q22 (WPM Presentation)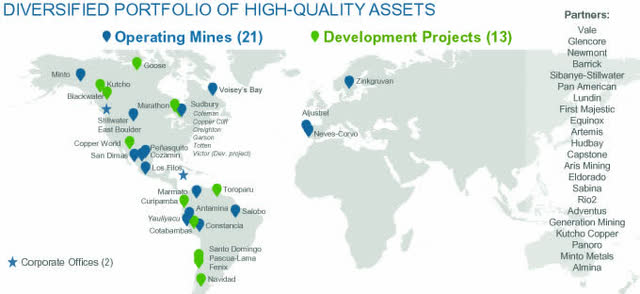
1 – A quick snapshot of the third quarter
The company generated weak revenues of $218.84 million during 3Q22, down 18.6% year-over-year. The adjusted income was $93.68 million, or $0.20 per share, compared to $137.09 million, or $0.30 per share, in 3Q21.
The company produced 159,852 GEOs or 11,989 SEOs in 3Q22 and sold 138,824 GEOs or 10,412 SEOs. Production was weak primarily due to lower output at Salobo and the closure of the 777 mine.
CEO Randy Smallwood said in the conference call:
While inflationary pressures are still impacting all sectors of the economy, especially mining, Wheaton has maintained cash operating margins of over 75% year-to-date, highlighting the resiliency of the streaming model in an inflationary environment. Furthermore, we have demonstrated our continued willingness to identify strategic opportunities, both externally and within our portfolio, that create value for our shareholders.
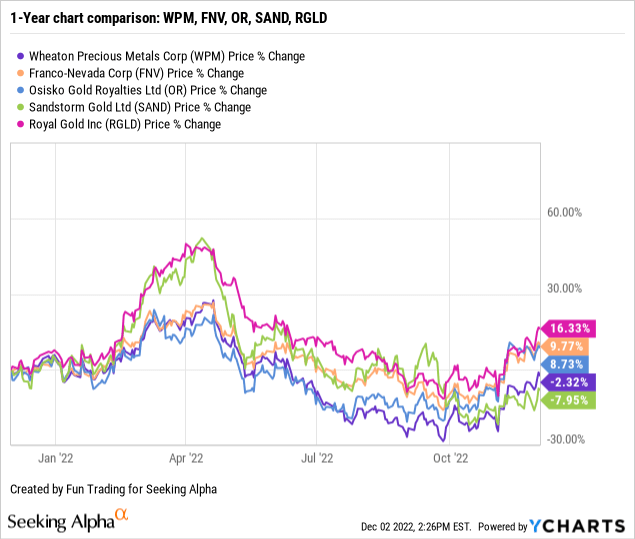
2 – Stock performance
Wheaton Precious Metals is part of my core long-term streamer with Franco-Nevada (FNV). Unfortunately, WPM has underperformed the group on a one-year basis but recovered recently and is now down 2%.
3 – Investment Thesis
WPM is one of my long-term investments in the royalties & streams segment with Franco-Nevada. I also own a small long-term position with Sandstorm Gold (SAND).
- I recommend reading my article on FNV’s recent earnings by clicking here.
- I recommend reading my article on SAND’s recent earnings by clicking here.
The investment thesis has not changed this quarter, and WPM is part of my core long-term position in the steamer category.
The gold and silver prices, which are crucial for the company’s revenues, have changed course recently after Chairman Jerome Powell signaled that the FED was ready to increase by a 50-point basis on December 14. Jerome Powell said:
It makes sense to moderate the pace of our rate increases as we approach the level of restraint that will be sufficient to bring inflation down[.]
The market quickly interpreted those comments, and the US dollar dropped while gold rallied. But I think it is far from sure that the FED will hike by 50 points instead of 75 basis points. The following job numbers and CPI for November will be crucial.
Powell said he thinks it’s likely the Fed will need to raise rates “somewhat” higher than estimated in September, and that there was “considerable uncertainty about what rate will be sufficient.”
WPM Gold and Silver price 1-year chart (Fun Trading StockCharts)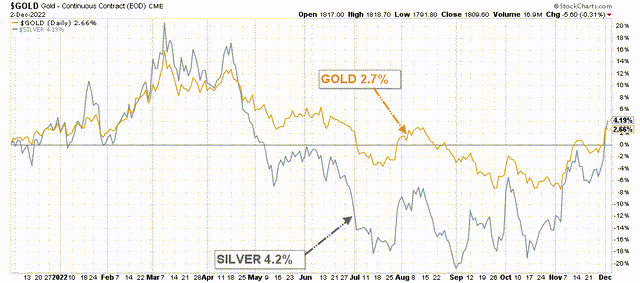
In conclusion, the gold sector is highly volatile and unpredictable. Thus, I suggest trading regularly short-term LIFO, a minimum of 30% of your long-term position.
This dual strategy has been my dominant strategy in my marketplace, “The Gold and oil corner,” and, I believe, it is the most rewarding strategy to maximize your profit while reducing risks significantly.
Wheaton Precious Metals: Financials And Production In 3Q22
| Wheaton Precious | 3Q21 | 4Q21 | 1Q22 | 2Q22 | 3Q22 |
| Total Revenues in $ Million | 268.96 | 278.20 | 307.24 | 302.92 | 218.84 |
| Net Income in $ Million | 134.94 | 291.82 | 157.47 | 149.07 | 196.46 |
| EBITDA $ Million | 192.19 | 352.35 | 215.96 | 210.74 | 264.62 |
| EPS diluted in $/share | 0.30 | 0.65 | 0.35 | 0.33 | 0.43 |
| Cash from operating activities in $ Million | 201.28 | 195.29 | 210.54 | 206.36 | 154.50 |
| Capital Expenditure in $ Million |
1.81 |
304.05 |
46.00 |
15.55 |
47.56 |
| Free Cash Flow in $ Million |
199.48 |
-108.76 |
164.54 |
190.81 |
106.93 |
| Total cash $ Million | 372.45 | 226.05 | 376.16 | 448.63 | 494.62 |
| Long-term debt in $ Million | 0.0 | 0.0 | 0.0 | 0.0 | 0.0 |
| Dividend per share in $ | 0.15 | 0.15 | 0.15 | 0.15 | 0.15 |
| Shares outstanding (diluted) in Million | 451.7 | 451.2 | 452.0 | 452.4 | 452.39 |
| Production details | 3Q21 | 4Q21 | 1Q22 | 2Q22 | 3Q22 |
| Production in Gold Equivalent K Oz GEO | 183.0 | 184.6 | 170.7 | 162.6 | 159.9 |
| Production in Silver Equivalent Oz SEO | 13,314 | 13,421 | 12,853 | 12,193 | 11,989 |
| Gold price realized $/Oz | 1,764 | 1,798 | 1,870 | 1,795 | 1,728* |
| Silver price realized $/Oz | 24.51 | 23.36 | 24.19 | 23.71 | 19.16* |
| The gold/silver ratio | 72.0 | 77.0 | 77.3 | 75.0 | 90.2 |
Source: Company release
* WPM sold its GEO at $1,576 per ounce and SEO at $21.02 per ounce.
Note 1: Historical data (more than four years) are only available for subscribers.
Analysis: Revenues, Earnings Details, Free Cash Flow, Debt, And Gold Production Details
1 – Revenues: Wheaton Precious Metals posted $218.84 million in revenue for 3Q22
WPM Quarterly Revenues history (Fun Trading) The third quarter of 2022 yielded revenue of $218.84 million (49% gold, 46% silver, 4% palladium, and 1% cobalt), down 18.6% on a year-over-year basis and down 27.8% sequentially.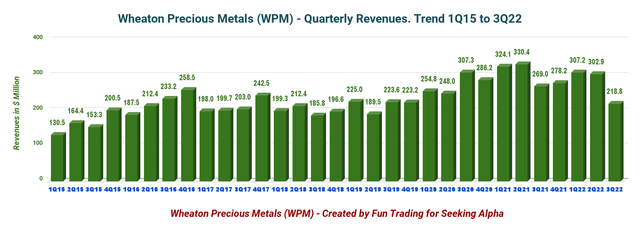
The adjusted net earnings were $93.88 million, or $0.20 per share, compared to $137.09 million, or $0.30 per share, in 3Q21. Cash costs were $474 per GEO, slightly lower than $464 per ounce a year ago.
The decline in attributable gold production was primarily due to lower output at Salobo and the closure of the 777 mine.
Cash from operating activities for the third quarter of 2022 was $154.50 million compared to $201.29 million in the prior year.
Below is shown the revenue per metal for the last four quarters. Cobalt production started in 1Q21:
WPM Quarterly revenues per metals from 3Q21 to 3Q22 (Fun Trading)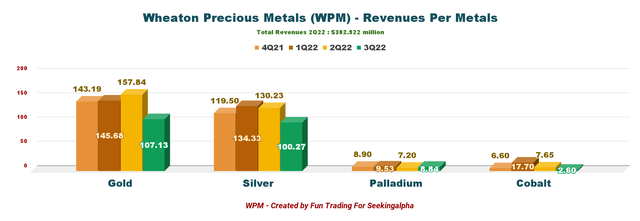
The gold price dropped sequentially to $1,728 per Au ounce, while the silver price was down to $19.16 per Ag ounce.
Please see the chart below:
WPM Quarterly price of gold and silver history (Fun Trading)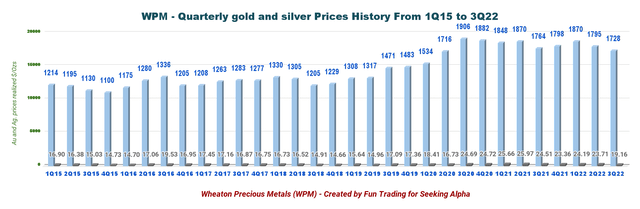
However, the price realized for gold production was sold at $1,728 per ounce, silver production at $19.16 per ounce, Palladium production at $2,091 per ounce, and Cobalt production at $22.68 per pound.
Finally, WPM sold its GEO at $1,576 and its SEO at $21.02.
2 – Free cash flow was estimated at $106.93 million in 3Q22
WPM Quarterly Free cash flow history (Fun Trading)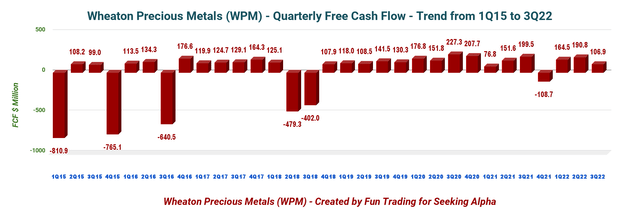
On September 30, 2021, the trailing 12-month FCF was estimated at $353.52 million, and the third quarter of 2022 was estimated at $106.93 million.
The Board of Directors declared a quarterly dividend of $0.15 per common share or a yield of 1.50%. The dividends are linked to operating cash flows.
WPM Dividend 3Q22 Presentation (WPM Presentation)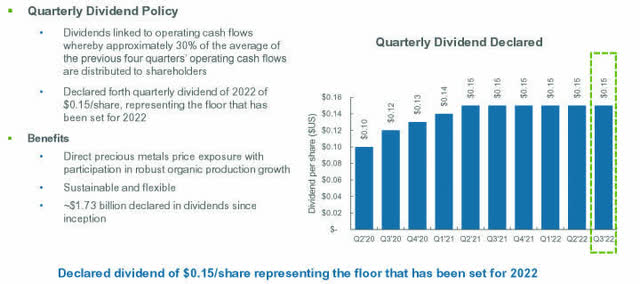
Note: Wheaton Precious Metals is a Canadian company, and dividends are subject to Canadian tax (15%) taken directly for non-Canadian investors, reducing the amount paid to investors, not from Canada.
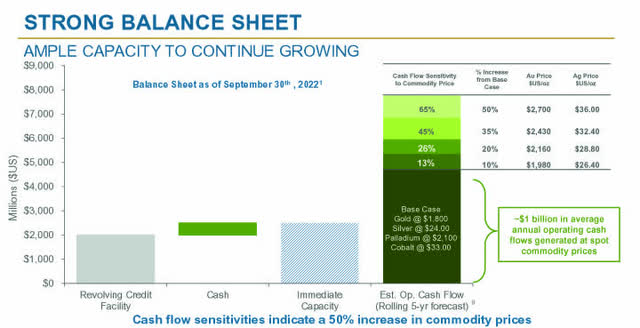
3 – Available capital, no debt, and $2 billion in liquidity
On September 30, 2022, Wheaton Precious Metals had cash and cash equivalents of $494.62 million and no debt outstanding under its Revolving Facility, which is excellent backing from a long-term investor’s perspective.
The company has a $2 billion revolver facility extended to July 18, 2027. Total liquidity of nearly $2.5 billion.
The chart below shows a significant net cash position:
WPM Quarterly Cash versus Debt history (Fun Trading) Also, WPM owns total long-term equity investments of $60.10 million in 3Q22 (Bear Creek, Sabina, Kutcho, and others). WPM Balance sheet (WPM Presentation) WPM Quarterly GEO production history (Fun Trading) This quarter’s gold equivalent production was 159,852 GEOs compared to 183,012 GEOs last year. Production in Silver equivalent ounces SEO was 11,989 SEOs. The company sold 138,824 GEOs during 3Q22, down massively from the prior-year quarter’s 176,502 GEOs. It was a weak production on the decline for the last four quarters.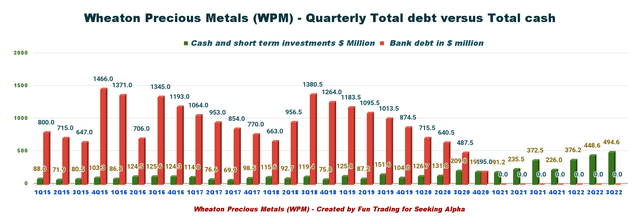
4 – Production in gold equivalent ounce and trend details
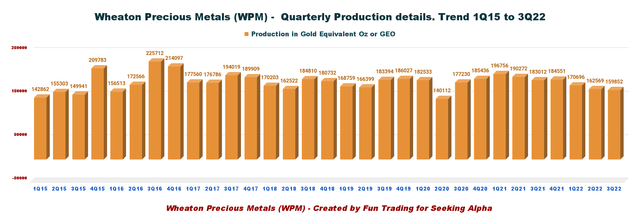
Wheaton’s metals production was:
- 73,508 Au ounces (sold 62,000 Au ounces).
- 5,883 Ag ounces (sold 5,234 Ag ounces).
- 3,229 Pd ounces (sold 4,227 Pd ounces).
- 226 Lbs of Cobalt (sold 115 Cobalt Lbs).
WPM Gold and Silver ratio history (Fun Trading) The gold/silver ratio is 1:90.2 this quarter (see chart above).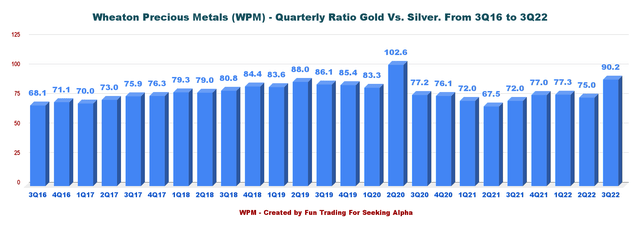
5 – 2021 Reserves (Total Proven and Probable) and 2022 guidance and recent acquisitions
5.1 – Reserves 2021 (unchanged from the preceding article)
As indicated in my previous article, the total mineral reserves of P1+P2 are 14.01 Moz of gold, 567.9 Moz of silver, 0.63 Moz of palladium, 0.17 Moz of platinum, and 31.4 Moz of cobalt.
5.2 – 2022 Guidance has been updated.
Wheaton’s estimated attributable production for 2022 is forecast to be 300K to 320K ounces of gold, 22.5 to 24.0 million ounces of silver, and 35K to 40K gold equivalent ounces (“GEOs”) of other metals, resulting in the production of approximately 640K to 680K GEOs.
CEO Randy Smallwood said in the conference call:
in the quarter, we completed the termination of the Keno Hill stream for $141 million and announced the proposed termination of the Yauliyacu stream with Glencore for $150 million. We are very happy with the returns these mines have brought us over the years.
As a result of the proposed termination of the Yauliyacu PMPA, the Company now expects average annual production for the five years ending December 31, 2026, to be approximately 800K GEOs (from 820K GEOs previously) and for the ten years ending December 31, 2031, to be about 850K GEOs (from 870K GEOs previously).
Technical Analysis and Commentary
WPM TA Chart short-term (Fun Trading StockCharts)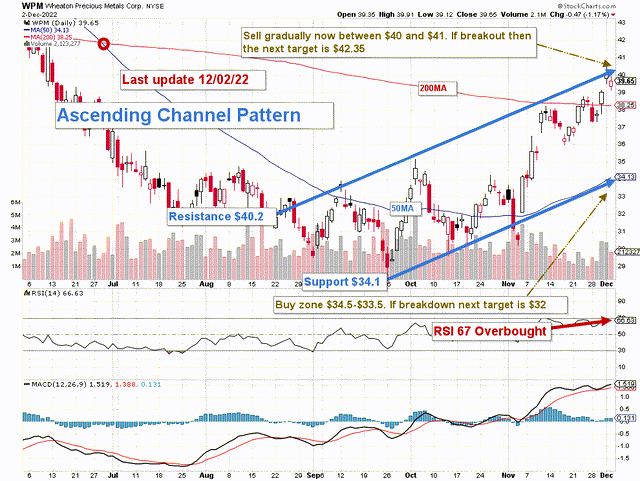
Note: The chart is adjusted for the dividend.
WPM forms an ascending channel pattern with resistance at $40.2 and support at $34.1. Ascending channel patterns are short-term bullish moving higher within an ascending channel, but these patterns often form within longer-term downtrends as continuation patterns. However, the RSI is overbought at 67 and signals a partial sell.
The trading strategy is to sell about 30%-35% of your position between $40 and $41 with potential higher resistance at $42.35.
I believe it is safe to accumulate WPM between $33.5 and $34.5 with possible lower support is $32.
The gold price turned bullish this week after the market learned that Jerome Powell is ready to
Thus, the dominant strategy that I regularly promote in my marketplace, “The gold and oil corner,” is to keep a core long-term position and use about 30% to trade LIFO while waiting for a higher final price target for your core long-term position between $50 and $55.
Trading LIFO allows you to sell your most recent purchases, assuming a profit while keeping your long-term position until your position has appreciated enough to consider selling it.
Warning: The TA chart must be updated frequently to be relevant. It is what I am doing in my stock tracker. The chart above has a possible validity of about a week. Remember, the TA chart is a tool only to help you adopt the right strategy. It is not a way to foresee the future. No one and nothing can.
Author’s note: If you find value in this article and would like to encourage such continued efforts, please click the “Like” button below as a vote of support. Thanks.
[ad_2]
Source link


