
[ad_1]
Khanchit Khirisutchalual/iStock via Getty Images
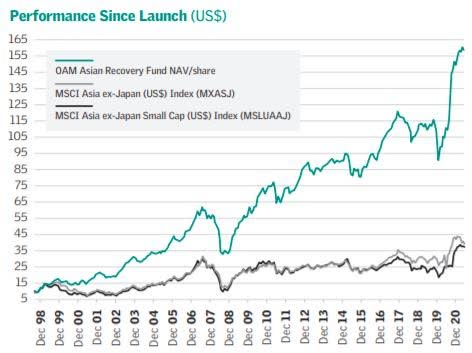
OAM Asian Recovery Fund
Dear Fellow Shareholder,
The Fund’s NAV/share increased by 9.3% last year. By comparison, the Fund’s benchmark, the MSCI Asia ex Japan (US$) index, declined by 6.4% last year. During the 23 years since inception, the Fund’s NAV compounded at 12.7% per annum, rising nearly 16-fold, while the MSCI Asia ex Japan (US$) index rose 285% or 6.0% per annum. The benchmark figures used for comparison do not include dividends. We estimate that if dividends, net of withholding taxes, are included in the benchmark returns, the benchmark returns would increase by less than 2 ½ percentage points per annum.
Competing asset classes
Whilst we are pleased with last year’s investment return, it pales in comparison with the 26.9% return of the S&P 500 and the 21.4% return of NASDAQ. US equities are the principal asset class competing with Asian equities. The market capitalisation of US equities is now well over half the value of all listed equities globally. The US stock market bubble continued to expand to epic proportions. I suspect that our children and grandchildren will be reading, watching and talking about this speculative orgy for decades to come. Other new competing asset classes have soaked up trillions of dollars of liquidity that would otherwise have been invested in equities, namely cryptocurrencies and non-fungible tokens.
Huge amounts of money are also flowing into venture capital and private equity on the strength of very high historic returns. Nearly 4 ½ years ago, the Cyclically-Adjusted P/E (CAPE)of US equities surpassed 30, putting valuations at that time in the 95th percentile of historic monthly valuations for US equities using 150 years of data published by Nobel Laureate Robert Shiller. Today, the CAPE of US equities is 40, putting it in the 99th percentile of valuations for US equities. The long-term average CAPE for US equities over the past 150 years is about 16. The extent of overvaluation gives no indication of the likely timing of a market crash, but they do give an indication of likely future returns which, based on historic correlations, suggest 10-year future returns for US equities of roughly zero.
A better guide to the likely timing of major market crashes is the degree of market speculation, particularly by gung-ho retail investors with no sense of how to value a company. Many of us have read about the shoe- shine boys on Wall Street in the late 1920’s and the Japanese housewives of the late 1980’s who were prominent players in the speculative manias in those markets before they collapsed spectacularly. Today, we have retail investors trading on apps like Robinhood, making effortless money, and in many cases, making highly leveraged bets through options (see OAM European Value Fund Chairman’s statement) and buying on margin.
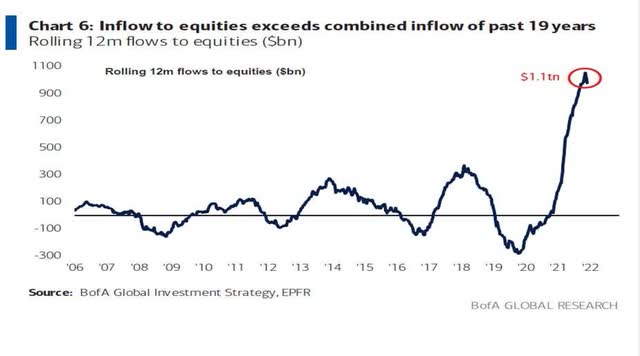
All these speculative manias were stoked by a combination of low interest rates, strong growth in money supply, momentum trading, seductive narratives, and a general psyche that there is nothing as irritating as seeing your friend/neighbour/colleague getting rich through effortless speculation, also known as FOMO (Fear of Missing Out). Here are a few charts that I collected recently to illustrate the degree of what is happening in the US equity market. The first chart shows the more than a trillion dollars that flowed into US equities last year, exceeding the net inflows over the previous 19 years.
The next chart shows the record allocation to equities by households. Investors have gone “all in” this past year on US equities as shown by these two charts. There is an inverse correlation between the allocation to equities by households and future equity returns. Previous peaks, shown in the chart below, of 30% at the end of 1968 and 38% at the end of Q1 2000 corresponded with major market peaks, and over the subsequent 10 years the S&P 500 index fell 7% and 22% respectively.
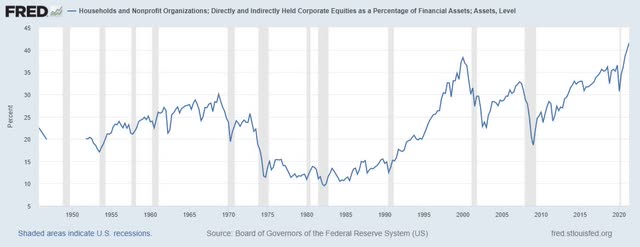
Minor peaks in Q2 2007 (immediately prior to the GFC) and the end of 2019 (immediately prior to the steep pandemic sell-off) were also not great times to go all-in on equities, though central bank actions in the immediate aftermath of each of these crises resulted in a strong rebound in equity markets. Investors today seem so confident that the Fed will successfully support markets from any steep fall that they have thrown all caution to the wind and the household allocation to equities was a record 41% in 2021.
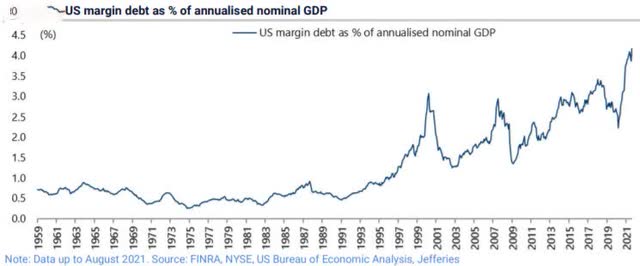
What is particularly worrying is that this allocation is fuelled by record margin debt taken on to buy equities as shown in the chart above. Prior peaks in margin debt in early 2000 and late 2007 corresponded with major market peaks. When equities decline, debt taken on to finance these holdings needs to be repaid and these investors become forced sellers. If the US stock market crashes spectacularly, most equity markets globally are likely to follow the US in the short-term.
But ultimately, money has to go somewhere, and today there are pockets of very good value, particularly in emerging market equities which are now a much despised and shunned asset class. We remain confident that this Fund is likely to generate an attractive return during the remainder of this decade, and certainly relative to nearly all competing asset classes and cash and bonds which yield close to zero.
A bad year for Chinese equities
Last year, the MSCI China index lost 22%, the CSI 300 index of Shanghai & Shenzhen equities lost 1%, and the Hang Seng index lost 12%, all expressed in US Dollars on a total return basis. This was principally a result of Beijing’s regulatory reforms last year which hurt many property developers, dominant internet platforms, and private for-profit education companies. This was done with the aim of achieving what the Chinese leadership dubs “common prosperity”.
There has been much misunderstanding about what common prosperity means. Cheah Cheng Hye, the founder of Value Partners which manages the largest single investment by our Fund, has been dubbed the Warren Buffett of Asia. He summed it up best when he said recently that: “Common prosperity does not emphasize wealth distribution. It is anti-monopoly and aims to promote a level playing field for business and make society more productive and fairer…. It does not intend to kill the entrepreneurial spirit of the Chinese people.”
We have had a number of clients ask us about how much we have invested in China, and whether we plan to reduce our investments in China. Our answers are “a lot” (though significantly less than the nearly half of our benchmark index that is invested in China/HK), and “no”. These queries seem to have been prompted by media coverage of China which often portrays China as a villain. Views of China are polarised and strongly held. My observation is that those who have not visited China in recent years or at all, do not speak to people living in China, or do not speak to people who visit China often, typically have a negative view of China.
Whereas those who visited recently, speak to people living there or who visit frequently tend to be much more positive about China’s outlook. We feel more confident investing in China’s future growth which currently commands a much lower multiple of earnings than the US. The US feels to us like a declining empire, but one where its equities are valued for a perfect future. We also think the Chinese renmimbi is undervalued and in coming decades is likely to be a better store of value than most other currencies. Last year, the Chinese renmimbi was the world’s strongest major currency, appreciating by an estimated 7% on a trade-weighted basis. Over the past two years, the renmimbi appreciated by nearly 10% against the US Dollar.
We think this is largely a result of China sticking to a conventional monetary policy while central banks in the developed world went on a money printing spree to alleviate the effects of COVID. Over the past two years, US M2 money supply increased by 18% per annum while the economy grew by about 3% per annum in nominal terms. Much of this excess money in the US went into financial assets, housing and some newer speculative asset classes. Over the prior 18 years, US M2 money supply grew at 6% per annum, more or less in line with nominal GDP growth of 4% per annum.
The US and the rest of the developed world engaged in huge fiscal expansion, first in response to the GFC and more recently due to the pandemic, which in the case of the US resulted in its budget deficit to GDP increasing from about 2% in 2007 to about 15% currently. Concurrently, central banks in the developed world increased their balance sheets massively, in the case of the US Federal Reserve tenfold in the past 13 years. Short-term interest rates were cut to zero and longer- term bond yields are being suppressed.
Contrast this with China where, over the past two years, M2 money supply growth was 9% per annum, similar to nominal GDP growth over the period of 7% per annum. Over the prior 18 years, M2 expanded at 14% per annum compared to nominal GDP growth of 12% per annum. In other words, China continues to pursue conventional monetary policy and there is not surplus cash sloshing around the economy to stoke frenzied speculation. Short-term interest rates are roughly in line with inflation. 10-year Chinese government bonds yield more than the rate of inflation, in contrast to similar term US Treasury bonds which yield substantially less than inflation. The Chinese central bank balance sheet only expanded about 2 ½ times in the past 13 years. And China’s budget deficit to GDP is less than half the US.
Our Fund’s investments in China and Hong Kong performed far better than the indices. We have three single company investments in China and Hong Kong. All three delivered positive returns. Our return from investing in China Yangtze, the largest generator of electricity in the world using hydro-electric power, was 24% last year. This is the Fund’s second largest investment in a single company on a look-through basis, comprising about 3% of its net assets. Its shares still look very undervalued on a 5.8% unlevered cap rate and a 8.5% levered cap rate for one of the greatest collection of infrastructure assets globally.
Its dams typically have a remaining useful life of at least 100 years, produce low-cost clean electricity, and the company is likely to increase its free cash flow per share faster than inflation through a combination of reinvestment, tariff increases and debt repayment, while requiring limited maintenance. In September 2020, Xi Jinping delivered a speech to the UN in which he committed China to adopt policies and measures to achieve peak carbon emissions by 2030 and carbon neutrality by 2060. Last year, electricity growth in China grew by an unexpected 12.9% during the first three quarters of the year, resulting in electricity shortages. China’s leadership is prioritising the development of clean energy and China Yangtze is a world leader in hydroelectricity generation at a very low cost.
Last month, the asset injection of the Wudonde and Baihetan dams in the lower reaches of the Yangtze was announced. This will increase China Yangtze’s generating capacity by nearly 60%. Details of the transaction have not yet been agreed, but the outline terms indicate that there should be a meaningful jump in China Yangtze’s free cash flow per share due to synergies and equity dilution that will be a lot less than the resulting earnings accretion.
Swire Pacific, the long-established holding company of the Swire family, has two classes of shares. We own the B shares which trade at an incredible 78% discount to NAV, yield over 5% free of withholding tax, and returned 10% last year. COSCO Shipping International, the shipping services subsidiary of COSCO Shipping, increased its dividend last year significantly and the shares now yield over 10% free of withholding tax. Last year, this investment returned 10%. The share price still extremely undervalues the company with net cash exceeding the company’s market capitalisation by more than 60% even though the company has never lost money in more than 15 years. We continue our discussions with the company, mainly in urging them to use their surplus cash intelligently.
Strong returns from India
Nearly 25% of the Fund’s assets are invested in India. Our Indian equity investments provided most of the Fund’s returns last year. The MSCI India (US$) index returned 26% last year. Our three Indian equity funds that invest exclusively in India (and to a small extent in the Indian sub-continent) returned 28.6% last year, net of fees and accruals for taxes. We are very pleased with the performance of our managers who we have known for many years before carefully selecting them to manage most of the Fund’s Indian exposure. This is particularly so given that India is the only market in which we invest globally that levies capital gains tax on equity investments. The benchmark index does not factor in this significant tax drag which makes the performance of our managers doubly impressive.
The Indian budget of 2018, with effect from 1 April 2018, ushered in a tax on long-term capital gains (LTCG) for publicly-listed equity shares held for over twelve months. Prior to this amendment, as per the domestic tax laws, there was no tax on LTCG on the sale of listed equity shares; only a 15% (plus applicable surcharge and cess) tax rate was applicable on short-term capital gains (STCG) from the sale of listed equity shares at the Fund level. Tax treaties with certain countries (such as Mauritius and Singapore) were amended to withdraw exemption on capital gains tax on equity shares with effect from 1st April 2017 with respect to purchases made on or after 1st April 2017. Accordingly, all Mauritius and Singapore Funds must now pay tax on capital gains as realised, with the exception of equities purchased prior to 1st April 2017 which are grandfathered. Presently the effective tax rates (for corporate investors) on capital gains derived from the sale of equities, with the addition of surcharges/cess, are 10.92% for LTCG and 16.38% for STCG. We have some grandfathered equity shares, which accounts for an estimated tenth of our Fund’s Indian exposure. All our funds accrue and provide for tax on unrealised gains at the LTCG rate. Not all funds use this approach, so caveat emptor when investing in India.
Indian equities are more expensive than our investments in other parts of Asia. This is in some respects justified by corporate profits as a % of GDP being cyclically depressed and the fact that India has a very long runway for future growth. India’s starting point of low per capita income and low consumer borrowing combined with the rapid digitalisation of the country create enormous tailwinds for consumer spending and financial inclusion for hundreds of millions of Indians. What we particularly like about India is that there are many high-quality businesses that we think have only just started their journey as compounding machines. After such a strong year, Indian equities may take a pause, but we think that our managers will make handsome returns for us over the next decade.
About 5% of our Fund on a look-through basis is invested in Bajaj Finance, making it the largest investment in a single company by the Fund. Almost all this exposure is through one of our Indian funds where the manager has over half his fund invested in the company. The manager was an early investor in Bajaj and he has most of his net worth invested in his fund, showing that he has both deep knowledge of the business and a massive alignment of interest with his investors. Making small loans to Indians wanting to buy consumer durables is Bajaj Finance’s core business. Indians bought only about US$40 billion of consumer durables (excluding cars but including phones) in 2019, and that entire segment had not much more than US$5 billion of credit outstanding which is tiny for a nearly $3 trillion economy. The estimated sales for air conditioners and refrigerators in India that year was less than US$5 billion each and for washing machines, it was estimated to be less than half that. Anyone can lend but getting repaid is trickier in a market like India. Amazon and Sequoia funded an entity to do digital lending in India. In 3 years of operation, it ended up with 38% delinquencies!
Bajaj Finance has nearly 53 million customers, adding 8-10 million new customers a year, and effectively cross sells to its customer base between different lines. For instance, as the largest seller of smart TVs and satellite subscription services, Netflix has chosen to partner with them to develop the Indian market. They also sell insurance and warranties on many of the consumer durables that they finance. Bajaj’s scale enables it to negotiate subvention deals with manufacturers whose products they finance which they factor into the pricing of loans to make them more competitive to customers, thereby increasing barriers to entry.
Two factors unique to India have enabled Bajaj Finance to grow rapidly without having high delinquencies on loans. The first was the introduction of Aadhaar, India’s Unique Identification (UID) system which gives every Indian a unique 12-digit digital ID number that is linked to a scanning of their 10 fingerprints and both irises. In order to buy a car, get a cooking gas subsidy from the government, or enter into virtually any transaction, you need to provide your UID. Your UID is also linked to your bank account((s)), credit and debit card((s)). Aadhaar linking enables the tracking of all financial transactions and even if Indians do not have income data, linking can provide information on that person’s cash flows.
In November 2016, Prime Minister Modi announced demonetisation whereby an astonishing 86% of India’s currency in circulation was withdrawn. The two measures brought a largely unbanked population that relied on cash as a means of exchange into a cashless economy that is now largely banked and digital. This enables the cost and time to perform KYC and on-board a new customer to plummet to a fraction of the time it used to take and still takes the state-owned banks that dominate Indian banking. It also allows a company like Bajaj to analyze consumer spending and income data using a database they have built that is several times larger and more comprehensive than that of its nearest competitor. Bajaj used to process loans in 3 hours when it took others 3-4 days. But now, Bajaj can process a loan in less than a minute and can deliver instant credit with pre-approved limits to all eligible customers.
More than 700 million Indians now own a smartphone, a 10-fold increase in 8 years. With 4G penetration rising on the back of cheap data rates, India’s data consumption has exploded. An annual mobile plan can be purchased for US$30 and gives the subscriber 1.5GB of data per day with unlimited voice and text. As a result, each Indian now consumes close to 15GB of data per smartphone per month, the highest in the world and well ahead of China! Ahead of demonetisation, the Indian government launched the Unified Payments Interface (UPI) in April 2016. It is a real-time interbank payment system for sending or receiving money using your mobile phone. UPI had already hit 1 billion transactions a month by March 2020. By November 2020 it was at 2 billion a month, and in November 2021, it was at 4.2 billion a month. UPI now represents 60% of India payments by volume and 40% of India’s GDP in value. Aadhaar and UPI have allowed Bajaj Finance to build a historical database of consumer cash flow and spending data that we think is unparalleled in the world. The company is using data analytics and its broad distribution reach to increase its customer base and sell them new services. Our manager has high conviction that Bajaj’s earnings should quadruple between the year ended March 2021 and the year ending March 2024, so although its shares look expensive based on trailing earnings, they look very attractively valued if he is right. On my next trip to India, I hope to spend a day at Bajaj Finance’s headquarters in Pune with the manager to get a deeper understanding of the business.
ASEAN markets – ignored and very undervalued
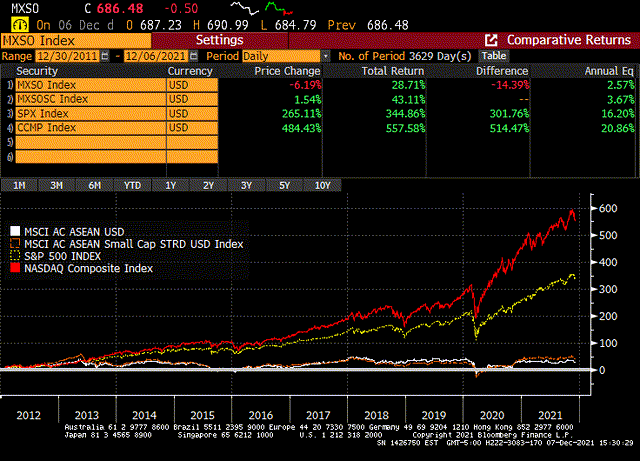
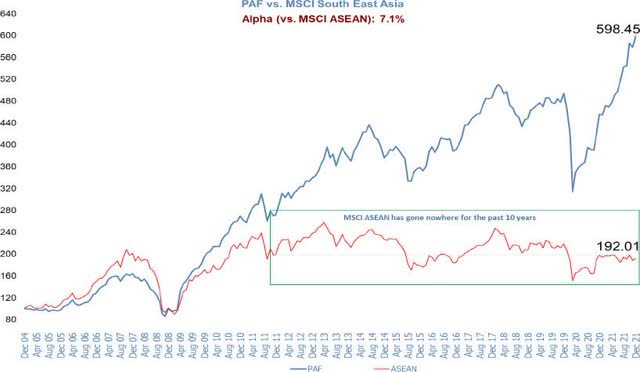
There are few investments more attractive than those that have gone sideways for a decade or more while intrinsic value compounds over the same period at an attractive rate …. unless the starting point is a period of extreme overvaluation. In the case of ASEAN markets, ten years ago, the P/E of the MSCI ASEAN index was only 13. As the chart below shows, the MSCI ASEAN and MSCI ASEAN Small Cap indices went sideways for the past 10 years. The only source of return was dividends. Contrast this with the 16% and 21% compound annual returns of the S&P 500 and NASDAQ indices (shown as yellow and red lines) over the same period. Our view is that ASEAN equity markets are very cheap and likely to produce stellar returns over the next decade. Relative to our Fund’s benchmark index, this is our biggest geographic overweight.
We have nearly 25% of the Fund invested in the ASEAN region and this is likely to increase. Nearly 10% of the Fund’s assets are invested in Indonesia, a country I first spent time in almost 40 years ago and which remains one of my favorite countries in the world to visit and explore. Indonesia has a population of nearly 300 million, making it the world’s fourth most populous country and the world’s 10th largest economy in terms of purchasing power parity, and a member of the G-20. Yet, it seems to be ignored by most investors as shown by this chart of the MSCI Indonesia Small Cap (US) index going back to the Fund’s launch in 1998.
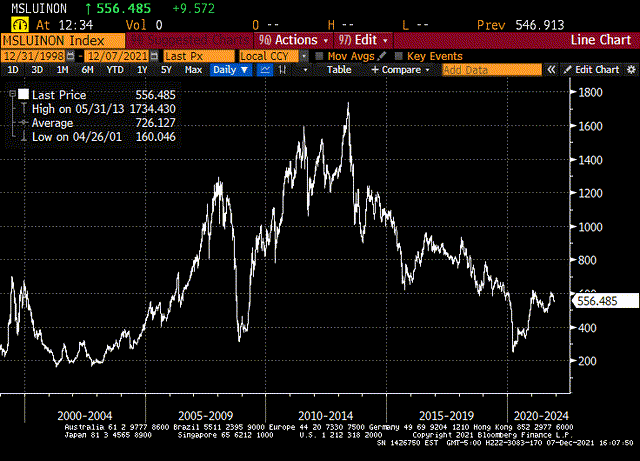
In 1998, Indonesia had a GDP of $125 billion. Today it is over $1.2 trillion, having grown at more than 10% per annum in US Dollars over the past 23 years. We have exposure to Indonesia through a number of managers. Our largest exposure is through a manager who lost his brokerage job during the 1997-98 Asian financial crisis and then backpacked around the region, particularly Indonesia for a few years. After he was laid off, he bought a handful of beaten-down Asian stocks that he deemed to be high quality companies selling at bargain valuations and set off on his travels. His portfolio did so well that he decided to start a fund. This is his fund’s track record.
As he so aptly states on his fund fact sheet, “ASEAN alone has a population of 660 million. That means there are 280 million girls yet to own a hairdryer. Not only is this bordering on human rights abuse, but is also an indicator of growing consumption.” Currently, over 70% of his fund is invested in Indonesia.
Assets remain stable but net redemptions continue
The Fund had $326 million in net assets at year end. During the year, there were $12 million in subscriptions and $36 million in redemptions. This is the eighth consecutive year that the Fund had net redemptions. The Fund’s shares outstanding declined by a third from their peak in mid-2014. Meanwhile, the Fund’s NAV/share has grown steadily and net assets have remained between $300 and $350 million for most of the period since then. My wife and I continue to add to our investment in the Fund so a rising numerator and a shrinking denominator have resulted in us together now being by far the largest shareholders in the Fund. The Directors and their wives in aggregate now own 20.3% of the Fund’s shares and entities which they manage or of which they are a director own an additional 3.4% of the Fund. At some point, when we finally get ahead of the constantly changing regulations that have distracted us far too much, we will market our approach and track record. In the meantime, there is not a lot to dislike about our record so far!
Desmond Kinch, CFA
Chairman
Original Post
Editor’s Note: The summary bullets for this article were chosen by Seeking Alpha editors.
General Disclaimer
[ad_2]
Source link