[ad_1]
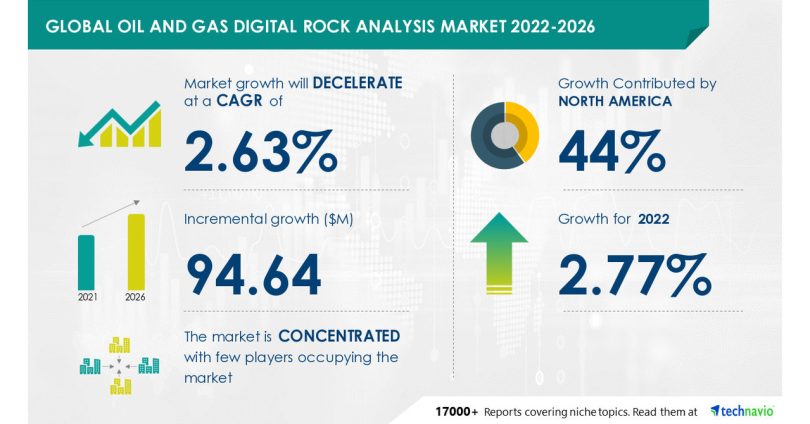
NEW YORK, Sept. 14, 2022 /PRNewswire/ — The “Oil and Gas Digital Rock Analysis Market by Type and Geography – Forecast and Analysis 2022-2026” report has been added to Technavio’s offering. The report expects the market size to grow by USD 94.64 million. However, the growth momentum is expected to decelerate at a CAGR of 2.63% during the forecast period. The report considers various aspects such as the consumer base, adoption rate, average selling price, revenue generated by vendors, and various other factors to estimate the market size. Download Sample PDF Report Here to get an idea of the overall scope of the full report.

The global oil and gas digital rock analysis market is concentrated because only a few vendors have gained significant expertise in providing different techniques for oil and gas digital rock analysis. The vendors operating in the market face moderate competition due to the presence of high exit barriers and the low cost of switching products among the vendors, which increases the threat of rivalry, whereas factors such as high product differentiation and moderate growth rate neutralize the threat of rivalry among the vendors.
The market requires high capital costs, regulatory approvals, and strong product expertise, which have led to a low threat of new entrants in the market. The growth and development of the market are highly dependent on the active oil and gas rig count. Therefore, factors such as growing oil and gas consumption and increasing investments in oil and gas E&P activities have led to an increase in the rig count, both onshore and offshore. Such factors will result in an increase in the demand for oil and gas digital rock analysis techniques during the forecast period.
Some of the dominant players in the market include Baker Hughes Co., CGG SA, Core Laboratories NV, Dassault Systemes SE, Halliburton Co., iRock Technologies Co. Ltd., Math2Market GmbH, Schlumberger Ltd., Thermo Fisher Scientific Inc., and Weatherford International Plc.
Although the growing consumption of oil and gas will offer immense growth opportunities, volatility in global crude oil prices will challenge the growth of the market participants. To make the most of the opportunities, market vendors should focus more on the growth prospects in the fast-growing segments, while maintaining their positions in the slow-growing segments.
The global oil and gas digital rock analysis market is segmented as below:
- Type
- Conventional
- Unconventional
The market growth in the conventional segment will be significant during the forecast period. The segment is driven by the increasing demand for oil and gas across the world.
- Geography
- North America
- APAC
- Europe
- The Middle East and Africa
- South America
North America is the largest geographical segment of the global oil and gas digital rock analysis market. The regional market is expected to grow significantly during the forecast period owing to a rising number of E&P projects. Technavio presents a detailed picture of the market by the way of study, synthesis, and summation of data from multiple sources. Our oil and gas digital rock analysis market report covers the following areas:
Oil and Gas Digital Rock Analysis Market 2022-2026: Vendor Analysis
We provide a detailed analysis of around 25 vendors operating in the oil and gas digital rock analysis market, including some of the dominant vendors. Backed with competitive intelligence and benchmarking, our research report on the oil and gas digital rock analysis market is designed to provide entry support, customer profile, and M&As as well as go-to-market strategy support.
Oil and Gas Digital Rock Analysis Market 2022-2026: Key Highlights
- CAGR of the market during the forecast period 2022-2026
- Detailed information on factors that will assist oil and gas digital rock analysis market growth during the next five years
- Estimation of the oil and gas digital rock analysis market size and its contribution to the parent market
- Predictions on upcoming trends and changes in consumer behavior
- The growth of the oil and gas digital rock analysis market
- Analysis of the market’s competitive landscape and detailed information on vendors
- Comprehensive details of factors that will challenge the growth of oil and gas digital rock analysis market vendors
Related Reports:
|
Oil And Gas Digital Rock Analysis Market Scope |
|
|
Report Coverage |
Details |
|
Page number |
120 |
|
Base year |
2021 |
|
Forecast period |
2022-2026 |
|
Growth momentum & CAGR |
Decelerate at a CAGR of 2.63% |
|
Market growth 2022-2026 |
USD 94.64 million |
|
Market structure |
Concentrated |
|
YoY growth (%) |
2.77 |
|
Regional analysis |
North America, APAC, Europe, Middle East and Africa, and South America |
|
Performing market contribution |
North America at 44% |
|
Key consumer countries |
US, Canada, China, Russia, and France |
|
Competitive landscape |
Leading companies, competitive strategies, consumer engagement scope |
|
Companies profiled |
Baker Hughes Co., CGG SA, Core Laboratories NV, Dassault Systemes SE, Halliburton Co., iRock Technologies Co. Ltd., Math2Market GmbH, Schlumberger Ltd., Thermo Fisher Scientific Inc., and Weatherford International Plc |
|
Market Dynamics |
Parent market analysis, Market growth inducers and obstacles, Fast-growing and slow-growing segment analysis, COVID-19 impact and future consumer dynamics, and market condition analysis for the forecast period. |
|
Customization purview |
If our report has not included the data that you are looking for, you can reach out to our analysts and get segments customized. |
Table Of Contents:
1 Executive Summary
- 1.1 Market overview
- Exhibit 01: Executive Summary – Chart on Market Overview
- Exhibit 02: Executive Summary – Data Table on Market Overview
- Exhibit 03: Executive Summary – Chart on Global Market Characteristics
- Exhibit 04: Executive Summary – Chart on Market by Geography
- Exhibit 05: Executive Summary – Chart on Market Segmentation by Type
- Exhibit 06: Executive Summary – Chart on Incremental Growth
- Exhibit 07: Executive Summary – Data Table on Incremental Growth
- Exhibit 08: Executive Summary – Chart on Vendor Market Positioning
2 Market Landscape
- 2.1 Market ecosystem
- Exhibit 09: Parent market
- Exhibit 10: Market Characteristics
3 Market Sizing
- 3.1 Market definition
- Exhibit 11: Offerings of vendors included in the market definition
- 3.2 Market segment analysis
- Exhibit 12: Market segments
- 3.4 Market outlook: Forecast for 2021-2026
- Exhibit 13: Chart on Global – Market size and forecast 2021-2026 ($ million)
- Exhibit 14: Data Table on Global – Market size and forecast 2021-2026 ($ million)
- Exhibit 15: Chart on Global Market: Year-over-year growth 2021-2026 (%)
- Exhibit 16: Data Table on Global Market: Year-over-year growth 2021-2026 (%)
4 Five Forces Analysis
- 4.1 Five forces summary
- Exhibit 17: Five forces analysis – Comparison between 2021 and 2026
- 4.2 Bargaining power of buyers
- Exhibit 18: Chart on Bargaining power of buyers – Impact of key factors 2021 and 2026
- 4.3 Bargaining power of suppliers
- Exhibit 19: Bargaining power of suppliers – Impact of key factors in 2021 and 2026
- 4.4 Threat of new entrants
- Exhibit 20: Threat of new entrants – Impact of key factors in 2021 and 2026
- 4.5 Threat of substitutes
- Exhibit 21: Threat of substitutes – Impact of key factors in 2021 and 2026
- 4.6 Threat of rivalry
- Exhibit 22: Threat of rivalry – Impact of key factors in 2021 and 2026
- 4.7 Market condition
- Exhibit 23: Chart on Market condition – Five forces 2021 and 2026
5 Market Segmentation by Type
- 5.1 Market segments
- Exhibit 24: Chart on Type – Market share 2021-2026 (%)
- Exhibit 25: Data Table on Type – Market share 2021-2026 (%)
- 5.2 Comparison by Type
- Exhibit 26: Chart on Comparison by Type
- Exhibit 27: Data Table on Comparison by Type
- 5.3 Conventional – Market size and forecast 2021-2026
- Exhibit 28: Chart on Conventional – Market size and forecast 2021-2026 ($ million)
- Exhibit 29: Data Table on Conventional – Market size and forecast 2021-2026 ($ million)
- Exhibit 30: Chart on Conventional – Year-over-year growth 2021-2026 (%)
- Exhibit 31: Data Table on Conventional – Year-over-year growth 2021-2026 (%)
- 5.4 Unconventional – Market size and forecast 2021-2026
- Exhibit 32: Chart on Unconventional – Market size and forecast 2021-2026 ($ million)
- Exhibit 33: Data Table on Unconventional – Market size and forecast 2021-2026 ($ million)
- Exhibit 34: Chart on Unconventional – Year-over-year growth 2021-2026 (%)
- Exhibit 35: Data Table on Unconventional – Year-over-year growth 2021-2026 (%)
- 5.5 Market opportunity by Type
- Exhibit 36: Market opportunity by Type ($ million)
6 Customer Landscape
- 6.1 Customer landscape overview
- Exhibit 37: Analysis of price sensitivity, lifecycle, customer purchase basket, adoption rates, and purchase criteria
7 Geographic Landscape
- 7.1 Geographic segmentation
- Exhibit 38: Chart on Market share by geography 2021-2026 (%)
- Exhibit 39: Data Table on Market share by geography 2021-2026 (%)
- 7.2 Geographic comparison
- Exhibit 40: Chart on Geographic comparison
- Exhibit 41: Data Table on Geographic comparison
- 7.3 North America – Market size and forecast 2021-2026
- Exhibit 42: Chart on North America – Market size and forecast 2021-2026 ($ million)
- Exhibit 43: Data Table on North America – Market size and forecast 2021-2026 ($ million)
- Exhibit 44: Chart on North America – Year-over-year growth 2021-2026 (%)
- Exhibit 45: Data Table on North America – Year-over-year growth 2021-2026 (%)
- 7.4 APAC – Market size and forecast 2021-2026
- Exhibit 46: Chart on APAC – Market size and forecast 2021-2026 ($ million)
- Exhibit 47: Data Table on APAC – Market size and forecast 2021-2026 ($ million)
- Exhibit 48: Chart on APAC – Year-over-year growth 2021-2026 (%)
- Exhibit 49: Data Table on APAC – Year-over-year growth 2021-2026 (%)
- 7.5 Europe – Market size and forecast 2021-2026
- Exhibit 50: Chart on Europe – Market size and forecast 2021-2026 ($ million)
- Exhibit 51: Data Table on Europe – Market size and forecast 2021-2026 ($ million)
- Exhibit 52: Chart on Europe – Year-over-year growth 2021-2026 (%)
- Exhibit 53: Data Table on Europe – Year-over-year growth 2021-2026 (%)
- 7.6 Middle East and Africa – Market size and forecast 2021-2026
- Exhibit 54: Chart on Middle East and Africa – Market size and forecast 2021-2026 ($ million)
- Exhibit 55: Data Table on Middle East and Africa – Market size and forecast 2021-2026 ($ million)
- Exhibit 56: Chart on Middle East and Africa – Year-over-year growth 2021-2026 (%)
- Exhibit 57: Data Table on Middle East and Africa – Year-over-year growth 2021-2026 (%)
- 7.7 South America – Market size and forecast 2021-2026
- Exhibit 58: Chart on South America – Market size and forecast 2021-2026 ($ million)
- Exhibit 59: Data Table on South America – Market size and forecast 2021-2026 ($ million)
- Exhibit 60: Chart on South America – Year-over-year growth 2021-2026 (%)
- Exhibit 61: Data Table on South America – Year-over-year growth 2021-2026 (%)
- 7.8 US – Market size and forecast 2021-2026
- Exhibit 62: Chart on US – Market size and forecast 2021-2026 ($ million)
- Exhibit 63: Data Table on US – Market size and forecast 2021-2026 ($ million)
- Exhibit 64: Chart on US – Year-over-year growth 2021-2026 (%)
- Exhibit 65: Data Table on US – Year-over-year growth 2021-2026 (%)
- 7.9 Canada – Market size and forecast 2021-2026
- Exhibit 66: Chart on Canada – Market size and forecast 2021-2026 ($ million)
- Exhibit 67: Data Table on Canada – Market size and forecast 2021-2026 ($ million)
- Exhibit 68: Chart on Canada – Year-over-year growth 2021-2026 (%)
- Exhibit 69: Data Table on Canada – Year-over-year growth 2021-2026 (%)
- 7.10 China – Market size and forecast 2021-2026
- Exhibit 70: Chart on China – Market size and forecast 2021-2026 ($ million)
- Exhibit 71: Data Table on China – Market size and forecast 2021-2026 ($ million)
- Exhibit 72: Chart on China – Year-over-year growth 2021-2026 (%)
- Exhibit 73: Data Table on China – Year-over-year growth 2021-2026 (%)
- 7.11 Russia – Market size and forecast 2021-2026
- Exhibit 74: Chart on Russia – Market size and forecast 2021-2026 ($ million)
- Exhibit 75: Data Table on Russia – Market size and forecast 2021-2026 ($ million)
- Exhibit 76: Chart on Russia – Year-over-year growth 2021-2026 (%)
- Exhibit 77: Data Table on Russia – Year-over-year growth 2021-2026 (%)
- 7.12 France – Market size and forecast 2021-2026
- Exhibit 78: Chart on France – Market size and forecast 2021-2026 ($ million)
- Exhibit 79: Data Table on France – Market size and forecast 2021-2026 ($ million)
- Exhibit 80: Chart on France – Year-over-year growth 2021-2026 (%)
- Exhibit 81: Data Table on France – Year-over-year growth 2021-2026 (%)
- 7.13 Market opportunity by geography
- Exhibit 82: Market opportunity by geography ($ million)
8 Drivers, Challenges, and Trends
- 8.3 Impact of drivers and challenges
- Exhibit 83: Impact of drivers and challenges in 2021 and 2026
9 Vendor Landscape
- 9.2 Vendor landscape
- Exhibit 84: Overview on Criticality of inputs and Factors of differentiation
- 9.3 Landscape disruption
- Exhibit 85: Overview on factors of disruption
- 9.4 Industry risks
- Exhibit 86: Impact of key risks on business
10 Vendor Analysis
- 10.1 Vendors covered
- Exhibit 87: Vendors covered
- 10.2 Market positioning of vendors
- Exhibit 88: Matrix on vendor position and classification
- 10.3 Baker Hughes Co.
- Exhibit 89: Baker Hughes Co. – Overview
- Exhibit 90: Baker Hughes Co. – Business segments
- Exhibit 91: Baker Hughes Co. – Key news
- Exhibit 92: Baker Hughes Co. – Key offerings
- Exhibit 93: Baker Hughes Co. – Segment focus
- 10.4 CGG SA
- Exhibit 94: CGG SA – Overview
- Exhibit 95: CGG SA – Business segments
- Exhibit 96: CGG SA – Key offerings
- Exhibit 97: CGG SA – Segment focus
- 10.5 Core Laboratories NV
- Exhibit 98: Core Laboratories NV – Overview
- Exhibit 99: Core Laboratories NV – Business segments
- Exhibit 100: Core Laboratories NV – Key offerings
- Exhibit 101: Core Laboratories NV – Segment focus
- 10.6 Dassault Systemes SE
- Exhibit 102: Dassault Systemes SE – Overview
- Exhibit 103: Dassault Systemes SE – Product / Service
- Exhibit 104: Dassault Systemes SE – Key news
- Exhibit 105: Dassault Systemes SE – Key offerings
- 10.7 Halliburton Co.
- Exhibit 106: Halliburton Co. – Overview
- Exhibit 107: Halliburton Co. – Business segments
- Exhibit 108: Halliburton Co. – Key news
- Exhibit 109: Halliburton Co. – Key offerings
- Exhibit 110: Halliburton Co. – Segment focus
- 10.8 iRock Technologies Co. Ltd.
- Exhibit 111: iRock Technologies Co. Ltd. – Overview
- Exhibit 112: iRock Technologies Co. Ltd. – Product / Service
- Exhibit 113: iRock Technologies Co. Ltd. – Key offerings
- 10.9 Math2Market GmbH
- Exhibit 114: Math2Market GmbH – Overview
- Exhibit 115: Math2Market GmbH – Product / Service
- Exhibit 116: Math2Market GmbH – Key offerings
- 10.10 Schlumberger Ltd.
- Exhibit 117: Schlumberger Ltd. – Overview
- Exhibit 118: Schlumberger Ltd. – Business segments
- Exhibit 119: Schlumberger Ltd. – Key offerings
- Exhibit 120: Schlumberger Ltd. – Segment focus
- 10.11 Thermo Fisher Scientific Inc.
- Exhibit 121: Thermo Fisher Scientific Inc. – Overview
- Exhibit 122: Thermo Fisher Scientific Inc. – Business segments
- Exhibit 123: Thermo Fisher Scientific Inc. – Key news
- Exhibit 124: Thermo Fisher Scientific Inc. – Key offerings
- Exhibit 125: Thermo Fisher Scientific Inc. – Segment focus
- 10.12 Weatherford International Plc
- Exhibit 126: Weatherford International Plc – Overview
- Exhibit 127: Weatherford International Plc – Business segments
- Exhibit 128: Weatherford International Plc – Key news
- Exhibit 129: Weatherford International Plc – Key offerings
- Exhibit 130: Weatherford International Plc – Segment focus
11 Appendix
- 11.2 Inclusions and exclusions checklist
- Exhibit 131: Inclusions checklist
- Exhibit 132: Exclusions checklist
- 11.3 Currency conversion rates for US$
- Exhibit 133: Currency conversion rates for US$
- 11.4 Research methodology
- Exhibit 134: Research methodology
- Exhibit 135: Validation techniques employed for market sizing
- Exhibit 136: Information sources
- 11.5 List of abbreviations
- Exhibit 137: List of abbreviations
About Us
Technavio is a leading global technology research and advisory company. Their research and analysis focus on emerging market trends and provides actionable insights to help businesses identify market opportunities and develop effective strategies to optimize their market positions. With over 500 specialized analysts, Technavio’s report library consists of more than 17,000 reports and counting, covering 800 technologies, spanning across 50 countries. Their client base consists of enterprises of all sizes, including more than 100 Fortune 500 companies. This growing client base relies on Technavio’s comprehensive coverage, extensive research, and actionable market insights to identify opportunities in existing and potential markets and assess their competitive positions within changing market scenarios.
Contact
Technavio Research
Jesse Maida
Media & Marketing Executive
US: +1 844 364 1100
UK: +44 203 893 3200
Email: [email protected]
Website: www.technavio.com/
SOURCE Technavio

[ad_2]
Source link


