[ad_1]

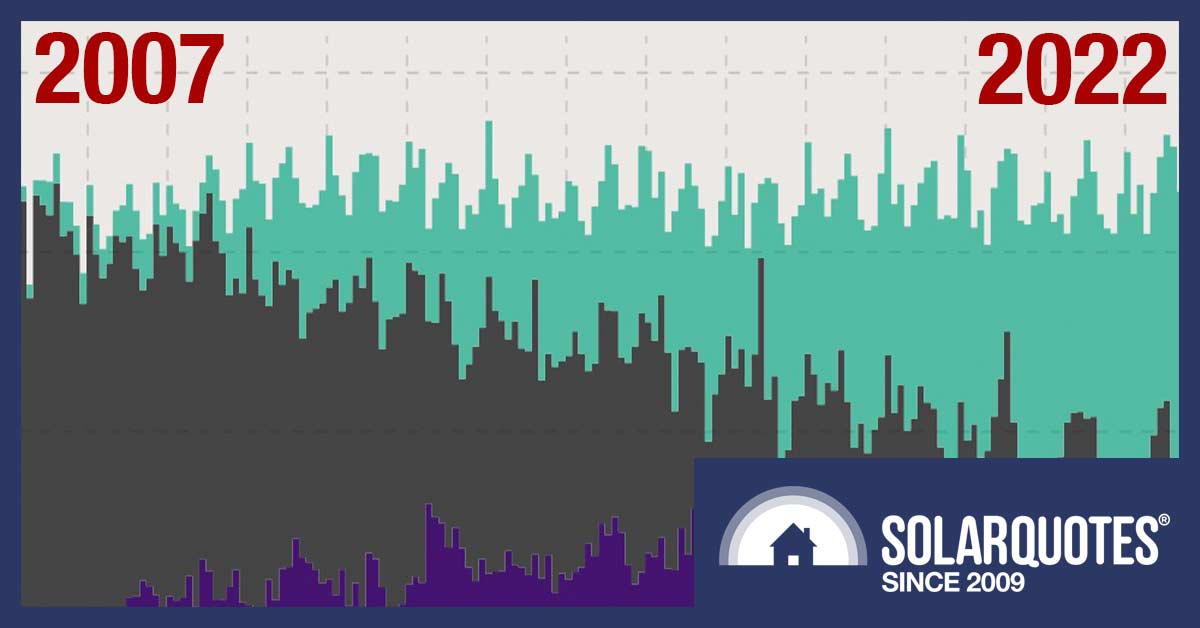
SA’s electricity generation mix: Green = Renewables, Black = Fossil, Purple = Imports.
In 2007, less than 1% of South Australia’s electricity came from renewable sources. An army of trolls claimed it was impossible for intermittent renewables to power more than 20% of SA’s grid.
Fast forward 15 years, and over 12 months, wind and solar power generated 70% of SA’s electricity while the percentage of consumption that was renewable was around 64%1.
South Australia is a world leader in wind and solar energy generation and will generate more renewable electricity than it consumes by 2030. Reaching 70% is an important milestone[Or, since we use metric in this country, an important 1.6 kilometre/6.35 kilogram].
AEMO Figures
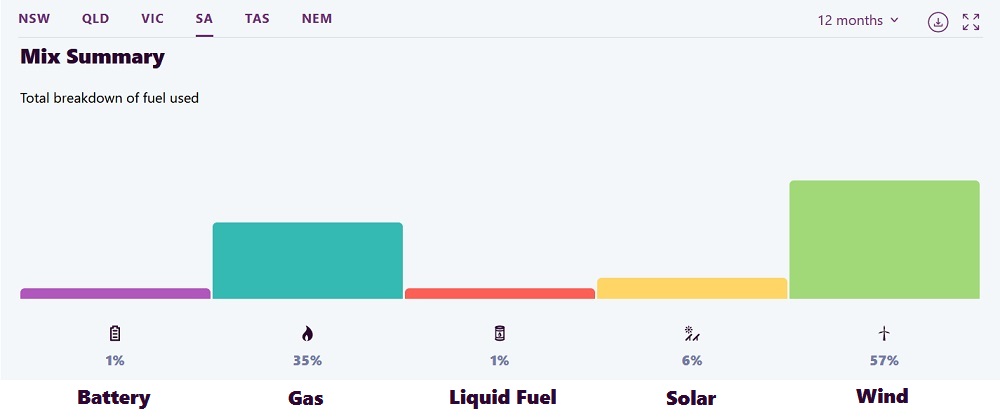
Here’s a graph from the Australian Electricity Market Operator (AEMO). It shows the percentage of large-scale electricity generation by each major source over the past year:

Wind was the largest source of electrical energy, providing nearly two-thirds more than natural gas. The state’s tiny quantity of hydroelectric generation is not shown, as its output is similar to a single wind turbine’s. (Image: AEMO)
Wind and solar power together account for 63% of generation. The state’s batteries are almost entirely charged with renewable electricity, so it may be reasonable to bump it up to 64%. But the AEMO figures fall short because they leave out rooftop solar panels. To determine solar power’s full contribution, I will use information from OpenNEM.
OpenNEM Figures
The NEM part of OpenNEM stands for National Electricity Market, which covers the eastern states but not WA or NT. The “open” part refers to how they put NEM info on the net for everyone to see.
We can be very confident that AEMO information is correct because they are in charge of operating the grid and have access to vast resources thanks to getting a cut of your electricity bill. OpenNEM does very well, considering they don’t operate a trans-continental electricity grid and only have access to extremely sub-vast resources.
Electricity Generation Percentage
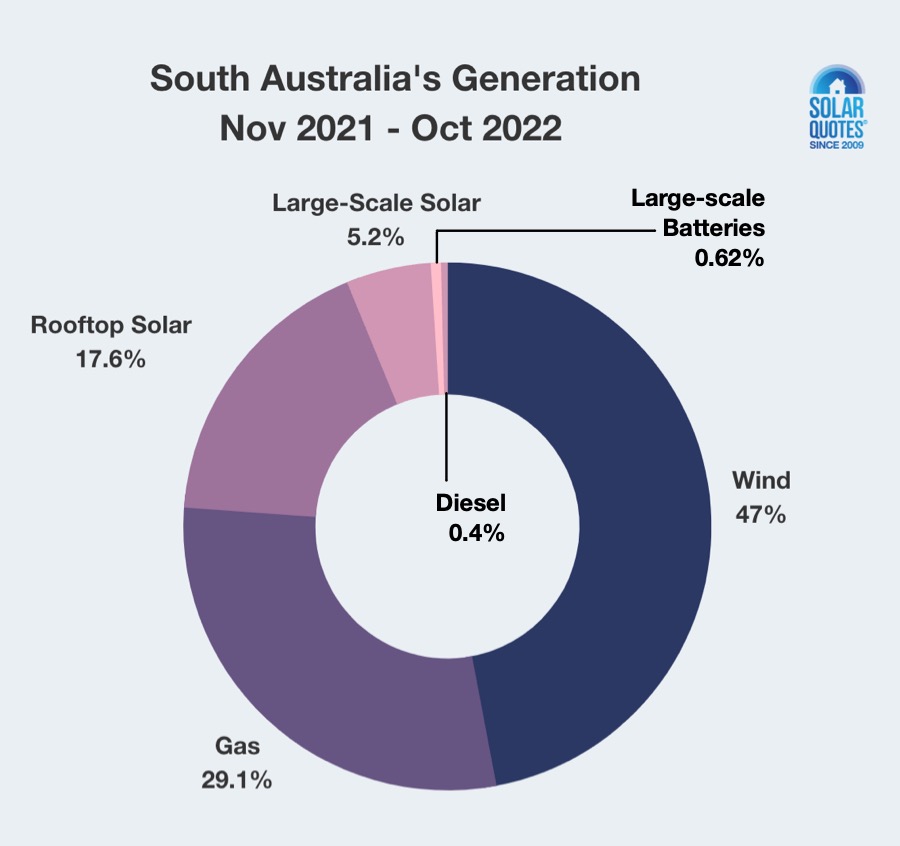
OpenNEM says South Australia generated 2,387 gigawatt-hours from rooftop solar panels over the past year — including small-scale solar farms of 100 kilowatts or less. Taking their figures for gigawatt-hours (GWh) of generation and using them to determine percentages gives the following:…

Assuming the batteries were charged with 70.3% renewable energy, wind and solar provided 70.3% of generation.
SA Smashing Gas
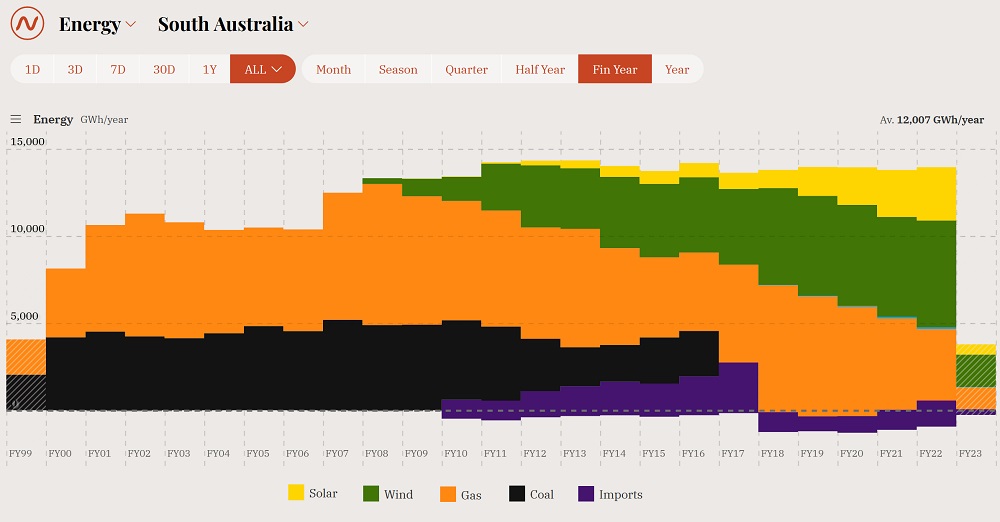
Below is OpenNEM showing SA electricity generation and imports for the past 23 years:

When columns extend below the dotted line it represents energy exported to Victoria. (Image: OpenNEM)
Since 2007, South Australian renewables have expanded rapidly, driving coal generation out of the state by 2016. This was followed by a temporary increase in gas that has steadily reduced. Last financial year, gas generation was close to half what it was in 2018-19. A good thing too, as that stuff costs a fortune at the moment.
The AEMO predicts South Australia will be producing more renewable electricity than its total electricity consumption by 2030. But I’ve got my hopes set on the state reaching that point well before then. Rooftop solar in South Australia is expanding rapidly and will only pick up pace when we’re hit with massive electricity price hikes next year.
Wind generation is also expanding in SA after a three-year hiatus. Australia’s second-largest wind farm, the 412-megawatt Goyder South project, is under construction northeast of Port Wakefield. It will be completed in 2024 but as they don’t like leaving completed wind turbines sitting idle, it will start contributing clean energy to the SA grid well before then.
When South Australia reaches 100% renewable energy generation, it will show the world a major region with no hydro can eliminate its reliance on fossil fuels. These world-changing developments are helping secure a safe future for us all. It’s a great time to be alive.
Footnotes
- Consumption is lower than generation because SA imported mostly fossil-fuelled electricity while its electricity exports were almost all renewable ↩
Related
[ad_2]
Source link


