
[ad_1]
onurdongel
Intro & Thesis
From its high of $130/bbl in March, WTI has fallen 38% and is now trying to move higher again after being rejected by strong support at $75-76.
You can argue for a long time about where oil prices will end up in 6-12 months and what specific stocks you need to pick to curb its rise or fall. That makes sense – check out my review of Journey Energy (OTCQX:JRNGF) and Occidental Petroleum (OXY) if you’re interested. However, most investors want to avoid betting on a single stock to protect their portfolios from high volatility – good diversification and issuer reliability are important to income-seeking investors, so many of them opt for ETFs.
I can relate to that approach – today I am going to introduce you to the ALPS Alerian MLP ETF (NYSEARCA:AMLP) fund, which I think has a lot of potential in terms of both dividend growth and reliability. I will provide an element-by-element analysis of the fund’s structural components based on their Factor grades, which Seeking Alpha publishes and continually updates and which have proven effective in the past.
What is ALPS Alerian MLP ETF?
It’s an exchange-traded fund (“ETF”) launched and managed by ALPS Advisors, Inc. since 2010, with about $7 billion of assets under management. According to Seeking Alpha, this ETF invests in MLPs operating across energy, transportation, storage, and processing of energy commodities sectors, trying to mimic the performance of its underlying index, the Alerian MLP Infrastructure Index.
What I like most about this ETF is the asset allocation. Andrew Hicks and Ryan Mischker – the portfolio managers of this ETF – invest exclusively in U.S. and Canadian companies (fewer country risks), and there were only 17 names in the most recent reporting period. That means the managers have the opportunity to study each MLP more closely before including it in the fund’s structure.
I also like the tandem of Mr. Hicks and Mr. Mischker – according to their bio descriptions [Fidelity Investments], both have vast experience and perform different functions (one of them performs research, the other oversees day-to-day operations). This certainly indicates a high-quality approach to management.
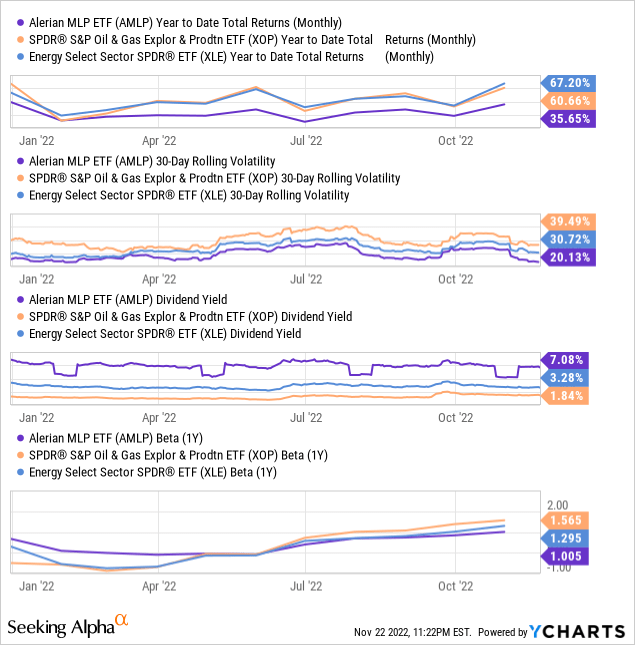
If we compare the returns of AMLP with the returns and costs of SPDR S&P Oil & Gas Exploration & Production ETF (XOP) or Energy Select Sector SPDR ETF (XLE), we see at first glance a clear advantage of listed peers over AMLP. However, in my opinion, the existing lag of AMLP is explained by allocation characteristics – both XLE and XOP have more diversified energy companies in their structures, while AMLP invests in high dividend stocks, mainly midstream companies with lower volatility. As a result, AMLP looks better than XOP in terms of volatility-adjusted returns (rolling over 30 days) and only slightly worse than XLE, while outperforming both in terms of dividend yield and having lower risks (both in terms of volatility measures and betas).
In addition, AMLP does not issue a K-1 rather it reports on a 1099 for taxes, so the fund’s investors can gain exposure to the MLP sector without dealing with Schedule K-1s.
Quantitative analysis of AMLP’s structure
I suggest you focus on the factor grades within the Quant Ratings of Seeking Alpha, which has proven to be efficient in generating real alpha above the S&P 500 Index (SPX) over a long period of time.
I uploaded AMLP’s data for the last reporting quarter (Q3 2022) as of August 31, 2022. It turns out that of the 17 holdings, 15 are MLPs, while the remaining 2 holdings are money market instruments and cash.
If we focus only on these 15 companies, it turns out that the 10 largest holdings account for more than 84% of the total fund:
Author’s calculations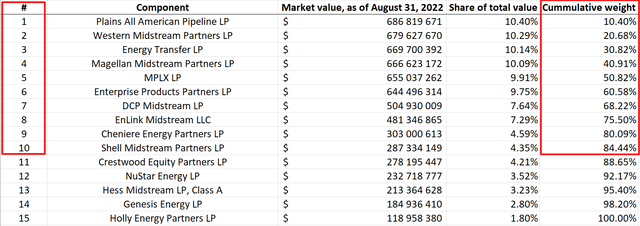
I collected all ratings for different periods (“NOW,” “3M,” and “6M”) for each of the 15 companies, except for Shell Midstream Partners, L.P. (SHLX), for which data are not available on Seeking Alpha. In addition to the classic factor grades, I also added the dividends-per-share Revisions Grade – this is very important to assess the growth potential of dividend payouts for the next 1-2 years. This is how the initial table looked like:
Author’s selection, based on SA data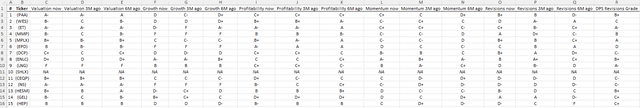
However, the ratings are presented in alphabetical form – for the quantitative analysis it’s necessary to quantify them. I will use the most common scale from “A+ to F-“, where the maximum is “A+” = 15 and the minimum “F-” = 1.
After the quantification, I calculated the weighted averages of the resulting figures, where the weights were the shares in the AMLP portfolio. In the dynamics of the last 6 months, during which AMPL gained 7.64%, the 5 key factors for the stocks in the fund’s portfolio (Shell Midstream was excluded from the sample) changed as follows:
Author’s calculations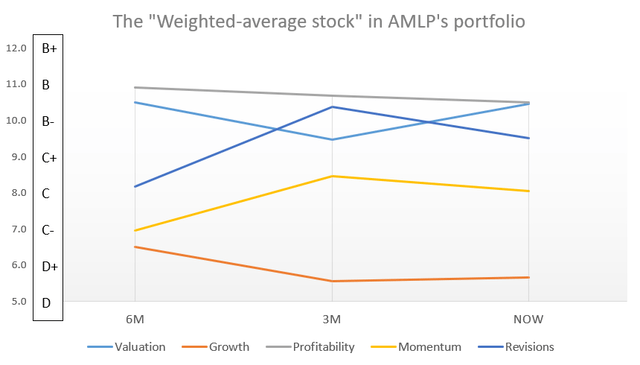
Here’s what the above graph looks like in tabular form:
| An average stock | 6M | 3M | NOW |
| Valuation | B (10.5) | B- (9.5) | B (10.5) |
| Growth | C- (6.5) | D+ (5.6) | D+ (5.7) |
| Profitability | B (10.9) | B (10.7) | B (10.5) |
| Momentum | C- (7.0) | C (8.5) | C (8.1) |
| Revisions | C (8.2) | B- (10.4) | B- (9.5) |
| DPS Revision | B- (10.2) |
Source: Author’s calculations.
Above you can see what the AMLP’s factor grades dynamic would look like if it was not an ETF but a conglomerate of midstream companies.
Valuation still appears quite favorable compared to the overall energy sector, despite recent growth.
The Growth factor is down 1 point from 6 months ago but is already slightly higher than 3 months ago.
Margins remain at “B” and show weak downward momentum (most likely due to relatively higher growth in the financials of energy stocks from other energy-related industries).
Revisions are down slightly in 3 months, but much better than 6 months ago – this is a comparative measure, but it speaks to a positive change in sentiment on the Street regarding midstream producers.
The weighted average of the DSP revision grade is “B-“, which I think indicates that analysts believe in the future growth of dividend payments – the key growth driver for AMLP.
Bottom Line
My quantitative analysis of the factors shows that AMLP’s holdings still look quite robust and have a high probability that the average company in this ETF will continue to have a high-enough margin to increase dividend payments over the next 1-3 years. So income-seeking investors will most likely continue to be satisfied with the real positive return, which will only grow as inflation declines.
A war in Europe, underinvestment in the energy industry, an imbalance of supply and demand in the oil and gas market (as well as metals and other commodities), and an overvaluation of the dollar that should lead to a fall in US Dollar Index (DXY) in the coming months – all this should lead to a recovery in oil prices, in my view. The higher the prices of oil and gas and the demand for these commodities, the higher the profits of midstream companies. At the same time, AMLP’s volatility and betas make this ETF more reliable for income-seeking investors than upstream-focused O&G ETFs like XOP and XLE.
Thank you for reading!
[ad_2]
Source link


