
[ad_1]
Today we’ll do a simple run through of a valuation method used to estimate the attractiveness of SEB SA (EPA:SK) as an investment opportunity by taking the expected future cash flows and discounting them to today’s value. One way to achieve this is by employing the Discounted Cash Flow (DCF) model. Before you think you won’t be able to understand it, just read on! It’s actually much less complex than you’d imagine.
We would caution that there are many ways of valuing a company and, like the DCF, each technique has advantages and disadvantages in certain scenarios. Anyone interested in learning a bit more about intrinsic value should have a read of the Simply Wall St analysis model.
Check out our latest analysis for SEB
The Method
We’re using the 2-stage growth model, which simply means we take in account two stages of company’s growth. In the initial period the company may have a higher growth rate and the second stage is usually assumed to have a stable growth rate. To begin with, we have to get estimates of the next ten years of cash flows. Where possible we use analyst estimates, but when these aren’t available we extrapolate the previous free cash flow (FCF) from the last estimate or reported value. We assume companies with shrinking free cash flow will slow their rate of shrinkage, and that companies with growing free cash flow will see their growth rate slow, over this period. We do this to reflect that growth tends to slow more in the early years than it does in later years.
A DCF is all about the idea that a dollar in the future is less valuable than a dollar today, so we discount the value of these future cash flows to their estimated value in today’s dollars:
10-year free cash flow (FCF) forecast
| 2023 | 2024 | 2025 | 2026 | 2027 | 2028 | 2029 | 2030 | 2031 | 2032 | |
| Levered FCF (€, Millions) | €557.3m | €516.1m | €491.2m | €475.2m | €465.0m | €458.4m | €454.5m | €452.2m | €451.2m | €451.0m |
| Growth Rate Estimate Source | Analyst x3 | Analyst x3 | Est @ -4.82% | Est @ -3.26% | Est @ -2.17% | Est @ -1.40% | Est @ -0.87% | Est @ -0.49% | Est @ -0.23% | Est @ -0.05% |
| Present Value (€, Millions) Discounted @ 11% | €504 | €422 | €363 | €318 | €281 | €250 | €224 | €202 | €182 | €165 |
(“Est” = FCF growth rate estimated by Simply Wall St)
Present Value of 10-year Cash Flow (PVCF) = €2.9b
After calculating the present value of future cash flows in the initial 10-year period, we need to calculate the Terminal Value, which accounts for all future cash flows beyond the first stage. The Gordon Growth formula is used to calculate Terminal Value at a future annual growth rate equal to the 5-year average of the 10-year government bond yield of 0.4%. We discount the terminal cash flows to today’s value at a cost of equity of 11%.
Terminal Value (TV)= FCF2032 × (1 + g) ÷ (r – g) = €451m× (1 + 0.4%) ÷ (11%– 0.4%) = €4.4b
Present Value of Terminal Value (PVTV)= TV / (1 + r)10= €4.4b÷ ( 1 + 11%)10= €1.6b
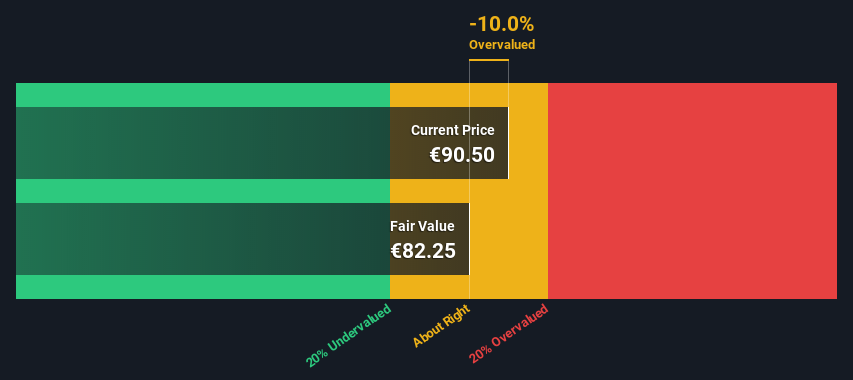
The total value is the sum of cash flows for the next ten years plus the discounted terminal value, which results in the Total Equity Value, which in this case is €4.5b. In the final step we divide the equity value by the number of shares outstanding. Compared to the current share price of €90.5, the company appears around fair value at the time of writing. Remember though, that this is just an approximate valuation, and like any complex formula – garbage in, garbage out.
Important Assumptions
Now the most important inputs to a discounted cash flow are the discount rate, and of course, the actual cash flows. You don’t have to agree with these inputs, I recommend redoing the calculations yourself and playing with them. The DCF also does not consider the possible cyclicality of an industry, or a company’s future capital requirements, so it does not give a full picture of a company’s potential performance. Given that we are looking at SEB as potential shareholders, the cost of equity is used as the discount rate, rather than the cost of capital (or weighted average cost of capital, WACC) which accounts for debt. In this calculation we’ve used 11%, which is based on a levered beta of 1.526. Beta is a measure of a stock’s volatility, compared to the market as a whole. We get our beta from the industry average beta of globally comparable companies, with an imposed limit between 0.8 and 2.0, which is a reasonable range for a stable business.
SWOT Analysis for SEB
- Debt is well covered by earnings.
- Earnings declined over the past year.
- Dividend is low compared to the top 25% of dividend payers in the Consumer Durables market.
- Annual earnings are forecast to grow faster than the French market.
- Good value based on P/E ratio compared to estimated Fair P/E ratio.
- Debt is not well covered by operating cash flow.
- Paying a dividend but company has no free cash flows.
- Annual revenue is forecast to grow slower than the French market.
Looking Ahead:
Although the valuation of a company is important, it shouldn’t be the only metric you look at when researching a company. DCF models are not the be-all and end-all of investment valuation. Preferably you’d apply different cases and assumptions and see how they would impact the company’s valuation. If a company grows at a different rate, or if its cost of equity or risk free rate changes sharply, the output can look very different. For SEB, there are three important items you should assess:
- Risks: To that end, you should learn about the 2 warning signs we’ve spotted with SEB (including 1 which can’t be ignored) .
- Future Earnings: How does SK’s growth rate compare to its peers and the wider market? Dig deeper into the analyst consensus number for the upcoming years by interacting with our free analyst growth expectation chart.
- Other Solid Businesses: Low debt, high returns on equity and good past performance are fundamental to a strong business. Why not explore our interactive list of stocks with solid business fundamentals to see if there are other companies you may not have considered!
PS. Simply Wall St updates its DCF calculation for every French stock every day, so if you want to find the intrinsic value of any other stock just search here.
Valuation is complex, but we’re helping make it simple.
Find out whether SEB is potentially over or undervalued by checking out our comprehensive analysis, which includes fair value estimates, risks and warnings, dividends, insider transactions and financial health.
View the Free Analysis
Have feedback on this article? Concerned about the content? Get in touch with us directly. Alternatively, email editorial-team (at) simplywallst.com.
This article by Simply Wall St is general in nature. We provide commentary based on historical data and analyst forecasts only using an unbiased methodology and our articles are not intended to be financial advice. It does not constitute a recommendation to buy or sell any stock, and does not take account of your objectives, or your financial situation. We aim to bring you long-term focused analysis driven by fundamental data. Note that our analysis may not factor in the latest price-sensitive company announcements or qualitative material. Simply Wall St has no position in any stocks mentioned.
[ad_2]
Source link


