
[ad_1]
Warren Buffett famously said, ‘Volatility is far from synonymous with risk.’ When we think about how risky a company is, we always like to look at its use of debt, since debt overload can lead to ruin. Importantly, Kanani Industries Limited (NSE:KANANIIND) does carry debt. But is this debt a concern to shareholders?
Why Does Debt Bring Risk?
Generally speaking, debt only becomes a real problem when a company can’t easily pay it off, either by raising capital or with its own cash flow. Ultimately, if the company can’t fulfill its legal obligations to repay debt, shareholders could walk away with nothing. While that is not too common, we often do see indebted companies permanently diluting shareholders because lenders force them to raise capital at a distressed price. Of course, the upside of debt is that it often represents cheap capital, especially when it replaces dilution in a company with the ability to reinvest at high rates of return. The first step when considering a company’s debt levels is to consider its cash and debt together.
See our latest analysis for Kanani Industries
What Is Kanani Industries’s Debt?
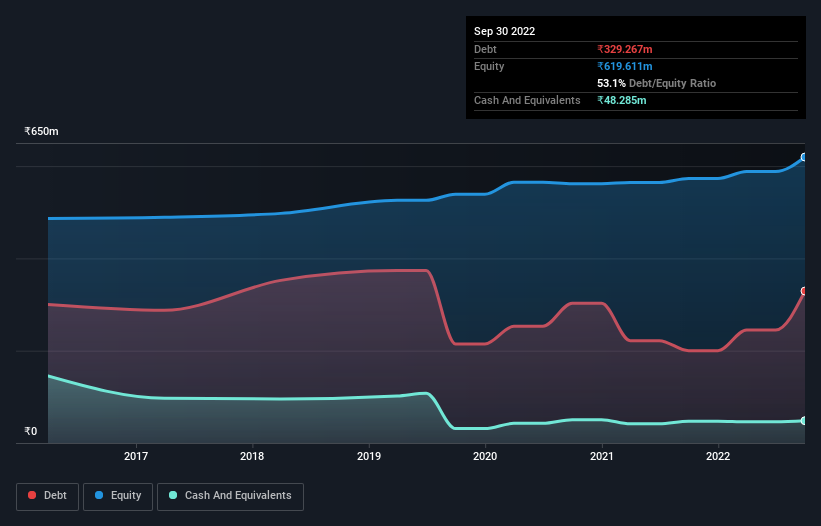
As you can see below, at the end of September 2022, Kanani Industries had ₹329.3m of debt, up from ₹200.0m a year ago. Click the image for more detail. However, because it has a cash reserve of ₹48.3m, its net debt is less, at about ₹281.0m.
A Look At Kanani Industries’ Liabilities
The latest balance sheet data shows that Kanani Industries had liabilities of ₹648.1m due within a year, and liabilities of ₹100.7m falling due after that. On the other hand, it had cash of ₹48.3m and ₹1.04b worth of receivables due within a year. So it can boast ₹342.8m more liquid assets than total liabilities.
This luscious liquidity implies that Kanani Industries’ balance sheet is sturdy like a giant sequoia tree. Having regard to this fact, we think its balance sheet is as strong as an ox.
In order to size up a company’s debt relative to its earnings, we calculate its net debt divided by its earnings before interest, tax, depreciation, and amortization (EBITDA) and its earnings before interest and tax (EBIT) divided by its interest expense (its interest cover). Thus we consider debt relative to earnings both with and without depreciation and amortization expenses.
With a net debt to EBITDA ratio of 8.3, it’s fair to say Kanani Industries does have a significant amount of debt. But the good news is that it boasts fairly comforting interest cover of 4.6 times, suggesting it can responsibly service its obligations. Notably, Kanani Industries’s EBIT launched higher than Elon Musk, gaining a whopping 284% on last year. There’s no doubt that we learn most about debt from the balance sheet. But you can’t view debt in total isolation; since Kanani Industries will need earnings to service that debt. So if you’re keen to discover more about its earnings, it might be worth checking out this graph of its long term earnings trend.
Finally, a company can only pay off debt with cold hard cash, not accounting profits. So the logical step is to look at the proportion of that EBIT that is matched by actual free cash flow. Over the last three years, Kanani Industries saw substantial negative free cash flow, in total. While investors are no doubt expecting a reversal of that situation in due course, it clearly does mean its use of debt is more risky.
Our View
Kanani Industries’s conversion of EBIT to free cash flow was a real negative on this analysis, as was its net debt to EBITDA. But like a ballerina ending on a perfect pirouette, it has not trouble growing its EBIT. When we consider all the elements mentioned above, it seems to us that Kanani Industries is managing its debt quite well. Having said that, the load is sufficiently heavy that we would recommend any shareholders keep a close eye on it. There’s no doubt that we learn most about debt from the balance sheet. But ultimately, every company can contain risks that exist outside of the balance sheet. Be aware that Kanani Industries is showing 3 warning signs in our investment analysis , and 2 of those don’t sit too well with us…
If, after all that, you’re more interested in a fast growing company with a rock-solid balance sheet, then check out our list of net cash growth stocks without delay.
Valuation is complex, but we’re helping make it simple.
Find out whether Kanani Industries is potentially over or undervalued by checking out our comprehensive analysis, which includes fair value estimates, risks and warnings, dividends, insider transactions and financial health.
View the Free Analysis
Have feedback on this article? Concerned about the content? Get in touch with us directly. Alternatively, email editorial-team (at) simplywallst.com.
This article by Simply Wall St is general in nature. We provide commentary based on historical data and analyst forecasts only using an unbiased methodology and our articles are not intended to be financial advice. It does not constitute a recommendation to buy or sell any stock, and does not take account of your objectives, or your financial situation. We aim to bring you long-term focused analysis driven by fundamental data. Note that our analysis may not factor in the latest price-sensitive company announcements or qualitative material. Simply Wall St has no position in any stocks mentioned.
[ad_2]
Source link


