[ad_1]
NEW YORK, Sept. 15, 2022 /PRNewswire/ — The “Submarine Power Cable Market” report has been added to Technavio’s offering. With ISO 9001:2015 certification, Technavio is proudly partnering with more than 100 Fortune 500 companies for over 16 years.

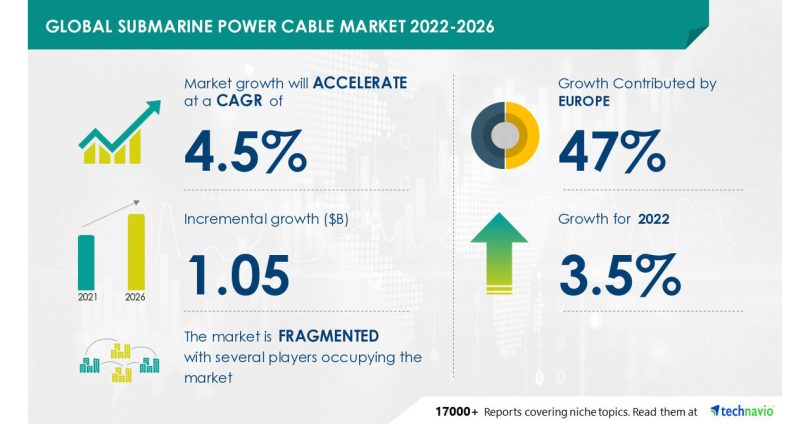
The potential growth difference for the submarine power cable market between 2021 and 2026 is USD 1.05 billion. The report extensively covers submarine power cable market segmentation by end-user (offshore wind, island connection and inter-country, offshore oil, and others) and geography (Europe, APAC, North America, Middle East, and Africa, and South America). To get the exact yearly growth variance and the Y-O-Y growth rate, Request Free Sample Report.
Key Market Dynamics:
- Market Driver
- Market Challenges
One of the key drivers supporting the growth of the submarine power cable market is the increasing offshore renewable energy installations. Offshore wind power installations are rapidly expanding due to their higher capacity output, which can be up to 40% greater than onshore wind power generation. The offshore wind submarine power cable market is critical for transmitting newly generated energy from offshore wind turbines to the shore.
The offshore wind submarine power cable industry enables renewable energy integration. Submarine power cable market growth is closely related to the expansion of offshore renewable energy installations and capacity, as these projects are powered by submarine power cables. However, factors such as challenges faced in laying and maintaining cables will challenge market growth. Buy Sample Report.
Submarine Power Cable Market Geographical Segmentation
Europe will account for 47% of market growth during the forecast period. The submarine power cable market in Europe is dominated by Germany and the United Kingdom. This region’s market growth will be slower than that of North America and APAC. Government support and a growing emphasis on wind energy will help the submarine power cable market grow in Europe over the forecast period.
The offshore wind segment’s submarine power cable market share will grow significantly. When compared to conventional turbines, offshore wind turbines can produce more energy with fewer turbines. Europe is home to more than 80% of the world’s offshore wind power generation capacity. European countries have set a goal of meeting more than 20% of their energy demand with renewables by 2030. During the forecast period, such factors may drive segment growth. Download Free Sample Report.
Some Companies Mentioned with their Offerings
- ABB Ltd.: The company provides flexibility and productivity for operations through the combination of robotics and machine automation.
- Eland Cables Ltd.: The company offers a variety of cables and cable accessories for various industries, including railway, mining, marine, construction, and various others.
- Fujikura Ltd.: The company offers Power cables, Telecommunication cables, Aluminum wires, Enameled wires, Optical fibers, Optical fiber cables, Telecommunication components, Optical components, Fiber optic equipment, Network equipment, and Installation.
- Furukawa Electric Co Ltd: The company offer solutions for optical fiber and cable products, FITEL products, broadband solutions business, and energy infrastructure.
- HELUKABEL Romania Srl: The company offers solar cable systems that include cables and cable systems for photovoltaic installations which help to produce electricity through an energy conversion process.
Related Reports:
HVAC Air Ducts Market by Material and Geography – Forecast and Analysis 2022-2026: The HVAC air duct market share is expected to increase by USD 1.54 billion from 2021 to 2026, and the market’s growth momentum will accelerate at a CAGR of 5.29%.
Industrial Gas Regulator Market by Technology and Geography – Forecast and Analysis 2022-2026: The industrial gas regulator market share is expected to increase by USD 2.39 billion from 2021 to 2026, and the market’s growth momentum will accelerate at a CAGR of 3.48%.
|
Submarine Power Cable Market Scope |
|
|
Report Coverage |
Details |
|
Page number |
120 |
|
Base year |
2021 |
|
Forecast period |
2022-2026 |
|
Growth momentum & CAGR |
Accelerate at a CAGR of over 4.5% |
|
Market growth 2022-2026 |
$ 1.05 billion |
|
Market structure |
Fragmented |
|
YoY growth (%) |
3.5 |
|
Regional analysis |
Europe, APAC, North America, Middle East and Africa, and South America |
|
Performing market contribution |
Europe at 47% |
|
Key consumer countries |
US, China, Japan, Germany, and UK |
|
Competitive landscape |
Leading companies, competitive strategies, consumer engagement scope |
|
Companies profiled |
ABB Ltd., Eland Cables Ltd., Europacable, Fujikura Ltd., Furukawa Electric Co Ltd, HELUKABEL Romania Srl, Hengtong Group Co Ltd, Hydro Group, Jiangsu Zhongtian Technology Co Ltd, KEI Industries Ltd, Leoni AG, LS Cable and System Ltd., Nexans SA, NKT AS, Parker Hannifin Corp., Prysmian Spa, Southwire Co. LLC, Subsea 7 SA, Sumitomo Electric Industries Ltd., and The Okonite Co. |
|
Market Dynamics |
Parent market analysis, Market growth inducers and obstacles, Fast-growing and slow-growing segment analysis, COVID-19 impact and future consumer dynamics, and market condition analysis for the forecast period. |
|
Customization purview |
If our report has not included the data that you are looking for, you can reach out to our analysts and get segments customized. |
Browse for Technavio “Industrials” Research Reports
Table of Contents
1 Executive Summary
- 1.1 Market overview
- Exhibit 01: Executive Summary – Chart on Market Overview
- Exhibit 02: Executive Summary – Data Table on Market Overview
- Exhibit 03: Executive Summary – Chart on Global Market Characteristics
- Exhibit 04: Executive Summary – Chart on Market by Geography
- Exhibit 05: Executive Summary – Chart on Market Segmentation by End-user
- Exhibit 06: Executive Summary – Chart on Incremental Growth
- Exhibit 07: Executive Summary – Data Table on Incremental Growth
- Exhibit 08: Executive Summary – Chart on Vendor Market Positioning
2 Market Landscape
- 2.1 Market ecosystem
- Exhibit 09: Parent market
- Exhibit 10: Market Characteristics
3 Market Sizing
- 3.1 Market definition
- Exhibit 11: Offerings of vendors included in the market definition
- 3.2 Market segment analysis
- Exhibit 12: Market segments
- 3.4 Market outlook: Forecast for 2021-2026
- Exhibit 13: Chart on Global – Market size and forecast 2021-2026 ($ million)
- Exhibit 14: Data Table on Global – Market size and forecast 2021-2026 ($ million)
- Exhibit 15: Chart on Global Market: Year-over-year growth 2021-2026 (%)
- Exhibit 16: Data Table on Global Market: Year-over-year growth 2021-2026 (%)
4 Five Forces Analysis
- 4.1 Five forces summary
- Exhibit 17: Five forces analysis – Comparison between 2021 and 2026
- 4.2 Bargaining power of buyers
- Exhibit 18: Chart on Bargaining power of buyers – Impact of key factors 2021 and 2026
- 4.3 Bargaining power of suppliers
- Exhibit 19: Bargaining power of suppliers – Impact of key factors in 2021 and 2026
- 4.4 Threat of new entrants
- Exhibit 20: Threat of new entrants – Impact of key factors in 2021 and 2026
- 4.5 Threat of substitutes
- Exhibit 21: Threat of substitutes – Impact of key factors in 2021 and 2026
- 4.6 Threat of rivalry
- Exhibit 22: Threat of rivalry – Impact of key factors in 2021 and 2026
- 4.7 Market condition
- Exhibit 23: Chart on Market condition – Five forces 2021 and 2026
5 Market Segmentation by End-user
- 5.1 Market segments
- Exhibit 24: Chart on End-user – Market share 2021-2026 (%)
- Exhibit 25: Data Table on End-user – Market share 2021-2026 (%)
- 5.2 Comparison by End-user
- Exhibit 26: Chart on Comparison by End-user
- Exhibit 27: Data Table on Comparison by End-user
- 5.3 Offshore wind – Market size and forecast 2021-2026
- Exhibit 28: Chart on Offshore wind – Market size and forecast 2021-2026 ($ million)
- Exhibit 29: Data Table on Offshore wind – Market size and forecast 2021-2026 ($ million)
- Exhibit 30: Chart on Offshore wind – Year-over-year growth 2021-2026 (%)
- Exhibit 31: Data Table on Offshore wind – Year-over-year growth 2021-2026 (%)
- 5.4 Island connection and inter-country – Market size and forecast 2021-2026
- Exhibit 32: Chart on Island connection and inter-country – Market size and forecast 2021-2026 ($ million)
- Exhibit 33: Data Table on Island connection and inter-country – Market size and forecast 2021-2026 ($ million)
- Exhibit 34: Chart on Island connection and inter-country – Year-over-year growth 2021-2026 (%)
- Exhibit 35: Data Table on Island connection and inter-country – Year-over-year growth 2021-2026 (%)
- 5.5 Offshore oil – Market size and forecast 2021-2026
- Exhibit 36: Chart on Offshore oil – Market size and forecast 2021-2026 ($ million)
- Exhibit 37: Data Table on Offshore oil – Market size and forecast 2021-2026 ($ million)
- Exhibit 38: Chart on Offshore oil – Year-over-year growth 2021-2026 (%)
- Exhibit 39: Data Table on Offshore oil – Year-over-year growth 2021-2026 (%)
- 5.6 Others – Market size and forecast 2021-2026
- Exhibit 40: Chart on Others – Market size and forecast 2021-2026 ($ million)
- Exhibit 41: Data Table on Others – Market size and forecast 2021-2026 ($ million)
- Exhibit 42: Chart on Others – Year-over-year growth 2021-2026 (%)
- Exhibit 43: Data Table on Others – Year-over-year growth 2021-2026 (%)
- 5.7 Market opportunity by End-user
- Exhibit 44: Market opportunity by End-user ($ million)
6 Customer Landscape
- 6.1 Customer landscape overview
- Exhibit 45: Analysis of price sensitivity, lifecycle, customer purchase basket, adoption rates, and purchase criteria
7 Geographic Landscape
- 7.1 Geographic segmentation
- Exhibit 46: Chart on Market share by geography 2021-2026 (%)
- Exhibit 47: Data Table on Market share by geography 2021-2026 (%)
- 7.2 Geographic comparison
- Exhibit 48: Chart on Geographic comparison
- Exhibit 49: Data Table on Geographic comparison
- 7.3 Europe – Market size and forecast 2021-2026
- Exhibit 50: Chart on Europe – Market size and forecast 2021-2026 ($ million)
- Exhibit 51: Data Table on Europe – Market size and forecast 2021-2026 ($ million)
- Exhibit 52: Chart on Europe – Year-over-year growth 2021-2026 (%)
- Exhibit 53: Data Table on Europe – Year-over-year growth 2021-2026 (%)
- 7.4 APAC – Market size and forecast 2021-2026
- Exhibit 54: Chart on APAC – Market size and forecast 2021-2026 ($ million)
- Exhibit 55: Data Table on APAC – Market size and forecast 2021-2026 ($ million)
- Exhibit 56: Chart on APAC – Year-over-year growth 2021-2026 (%)
- Exhibit 57: Data Table on APAC – Year-over-year growth 2021-2026 (%)
- 7.5 North America – Market size and forecast 2021-2026
- Exhibit 58: Chart on North America – Market size and forecast 2021-2026 ($ million)
- Exhibit 59: Data Table on North America – Market size and forecast 2021-2026 ($ million)
- Exhibit 60: Chart on North America – Year-over-year growth 2021-2026 (%)
- Exhibit 61: Data Table on North America – Year-over-year growth 2021-2026 (%)
- 7.6 Middle East and Africa – Market size and forecast 2021-2026
- Exhibit 62: Chart on Middle East and Africa – Market size and forecast 2021-2026 ($ million)
- Exhibit 63: Data Table on Middle East and Africa – Market size and forecast 2021-2026 ($ million)
- Exhibit 64: Chart on Middle East and Africa – Year-over-year growth 2021-2026 (%)
- Exhibit 65: Data Table on Middle East and Africa – Year-over-year growth 2021-2026 (%)
- 7.7 South America – Market size and forecast 2021-2026
- Exhibit 66: Chart on South America – Market size and forecast 2021-2026 ($ million)
- Exhibit 67: Data Table on South America – Market size and forecast 2021-2026 ($ million)
- Exhibit 68: Chart on South America – Year-over-year growth 2021-2026 (%)
- Exhibit 69: Data Table on South America – Year-over-year growth 2021-2026 (%)
- 7.8 US – Market size and forecast 2021-2026
- Exhibit 70: Chart on US – Market size and forecast 2021-2026 ($ million)
- Exhibit 71: Data Table on US – Market size and forecast 2021-2026 ($ million)
- Exhibit 72: Chart on US – Year-over-year growth 2021-2026 (%)
- Exhibit 73: Data Table on US – Year-over-year growth 2021-2026 (%)
- 7.9 Germany – Market size and forecast 2021-2026
- Exhibit 74: Chart on Germany – Market size and forecast 2021-2026 ($ million)
- Exhibit 75: Data Table on Germany – Market size and forecast 2021-2026 ($ million)
- Exhibit 76: Chart on Germany – Year-over-year growth 2021-2026 (%)
- Exhibit 77: Data Table on Germany – Year-over-year growth 2021-2026 (%)
- 7.10 China – Market size and forecast 2021-2026
- Exhibit 78: Chart on China – Market size and forecast 2021-2026 ($ million)
- Exhibit 79: Data Table on China – Market size and forecast 2021-2026 ($ million)
- Exhibit 80: Chart on China – Year-over-year growth 2021-2026 (%)
- Exhibit 81: Data Table on China – Year-over-year growth 2021-2026 (%)
- 7.11 UK – Market size and forecast 2021-2026
- Exhibit 82: Chart on UK – Market size and forecast 2021-2026 ($ million)
- Exhibit 83: Data Table on UK – Market size and forecast 2021-2026 ($ million)
- Exhibit 84: Chart on UK – Year-over-year growth 2021-2026 (%)
- Exhibit 85: Data Table on UK – Year-over-year growth 2021-2026 (%)
- 7.12 Japan – Market size and forecast 2021-2026
- Exhibit 86: Chart on Japan – Market size and forecast 2021-2026 ($ million)
- Exhibit 87: Data Table on Japan – Market size and forecast 2021-2026 ($ million)
- Exhibit 88: Chart on Japan – Year-over-year growth 2021-2026 (%)
- Exhibit 89: Data Table on Japan – Year-over-year growth 2021-2026 (%)
- 7.13 Market opportunity by geography
- Exhibit 90: Market opportunity by geography ($ million)
8 Drivers, Challenges, and Trends
- 8.3 Impact of drivers and challenges
- Exhibit 91: Impact of drivers and challenges in 2021 and 2026
9 Vendor Landscape
- 9.2 Vendor landscape
- Exhibit 92: Overview on Criticality of inputs and Factors of differentiation
- 9.3 Landscape disruption
- Exhibit 93: Overview on factors of disruption
- 9.4 Industry risks
- Exhibit 94: Impact of key risks on business
10 Vendor Analysis
- 10.1 Vendors covered
- Exhibit 95: Vendors covered
- 10.2 Market positioning of vendors
- Exhibit 96: Matrix on vendor position and classification
- 10.3 ABB Ltd.
- Exhibit 97: ABB Ltd. – Overview
- Exhibit 98: ABB Ltd. – Business segments
- Exhibit 99: ABB Ltd. – Key offerings
- Exhibit 100: ABB Ltd. – Segment focus
- 10.4 Eland Cables Ltd.
- Exhibit 101: Eland Cables Ltd. – Overview
- Exhibit 102: Eland Cables Ltd. – Product / Service
- Exhibit 103: Eland Cables Ltd. – Key offerings
- 10.5 Fujikura Ltd.
- Exhibit 104: Fujikura Ltd. – Overview
- Exhibit 105: Fujikura Ltd. – Business segments
- Exhibit 106: Fujikura Ltd. – Key offerings
- Exhibit 107: Fujikura Ltd. – Segment focus
- 10.6 Furukawa Electric Co Ltd
- Exhibit 108: Furukawa Electric Co Ltd – Overview
- Exhibit 109: Furukawa Electric Co Ltd – Business segments
- Exhibit 110: Furukawa Electric Co Ltd – Key offerings
- Exhibit 111: Furukawa Electric Co Ltd – Segment focus
- 10.7 Hengtong Group Co Ltd
- Exhibit 112: Hengtong Group Co Ltd – Overview
- Exhibit 113: Hengtong Group Co Ltd – Product / Service
- Exhibit 114: Hengtong Group Co Ltd – Key offerings
- 10.8 Leoni AG
- Exhibit 115: Leoni AG – Overview
- Exhibit 116: Leoni AG – Business segments
- Exhibit 117: Leoni AG – Key news
- Exhibit 118: Leoni AG – Key offerings
- Exhibit 119: Leoni AG – Segment focus
- 10.9 Nexans SA
- Exhibit 120: Nexans SA – Overview
- Exhibit 121: Nexans SA – Business segments
- Exhibit 122: Nexans SA – Key offerings
- Exhibit 123: Nexans SA – Segment focus
- 10.10 NKT AS
- Exhibit 124: NKT AS – Overview
- Exhibit 125: NKT AS – Business segments
- Exhibit 126: NKT AS – Key offerings
- Exhibit 127: NKT AS – Segment focus
- 10.11 Prysmian Spa
- Exhibit 128: Prysmian Spa – Overview
- Exhibit 129: Prysmian Spa – Business segments
- Exhibit 130: Prysmian Spa – Key offerings
- Exhibit 131: Prysmian Spa – Segment focus
- 10.12 Sumitomo Electric Industries Ltd.
- Exhibit 132: Sumitomo Electric Industries Ltd. – Overview
- Exhibit 133: Sumitomo Electric Industries Ltd. – Business segments
- Exhibit 134: Sumitomo Electric Industries Ltd. – Key news
- Exhibit 135: Sumitomo Electric Industries Ltd. – Key offerings
- Exhibit 136: Sumitomo Electric Industries Ltd. – Segment focus
11 Appendix
- 11.2 Inclusions and exclusions checklist
- Exhibit 137: Inclusions checklist
- Exhibit 138: Exclusions checklist
- 11.3 Currency conversion rates for US$
- Exhibit 139: Currency conversion rates for US$
- 11.4 Research methodology
- Exhibit 140: Research methodology
- Exhibit 141: Validation techniques employed for market sizing
- Exhibit 142: Information sources
- 11.5 List of abbreviations
- Exhibit 143: List of abbreviations
About Us
Technavio is a leading global technology research and advisory company. Their research and analysis focuses on emerging market trends and provides actionable insights to help businesses identify market opportunities and develop effective strategies to optimize their market positions.
With over 500 specialized analysts, Technavio’s report library consists of more than 17,000 reports and counting, covering 800 technologies, spanning across 50 countries. Their client base consists of enterprises of all sizes, including more than 100 Fortune 500 companies. This growing client base relies on Technavio’s comprehensive coverage, extensive research, and actionable market insights to identify opportunities in existing and potential markets and assess their competitive positions within changing market scenarios.
Contact
Technavio Research
Jesse Maida
Media & Marketing Executive
US: +1 844 364 1100
UK: +44 203 893 3200
Email:[email protected]
Website: www.technavio.com/
SOURCE Technavio

[ad_2]
Source link


