
[ad_1]
Some say volatility, rather than debt, is the best way to think about risk as an investor, but Warren Buffett famously said that ‘Volatility is far from synonymous with risk.’ It’s only natural to consider a company’s balance sheet when you examine how risky it is, since debt is often involved when a business collapses. Importantly, M/I Homes, Inc. (NYSE:MHO) does carry debt. But should shareholders be worried about its use of debt?
Why Does Debt Bring Risk?
Debt and other liabilities become risky for a business when it cannot easily fulfill those obligations, either with free cash flow or by raising capital at an attractive price. Part and parcel of capitalism is the process of ‘creative destruction’ where failed businesses are mercilessly liquidated by their bankers. However, a more common (but still painful) scenario is that it has to raise new equity capital at a low price, thus permanently diluting shareholders. Of course, plenty of companies use debt to fund growth, without any negative consequences. The first thing to do when considering how much debt a business uses is to look at its cash and debt together.
View our latest analysis for M/I Homes
What Is M/I Homes’s Net Debt?
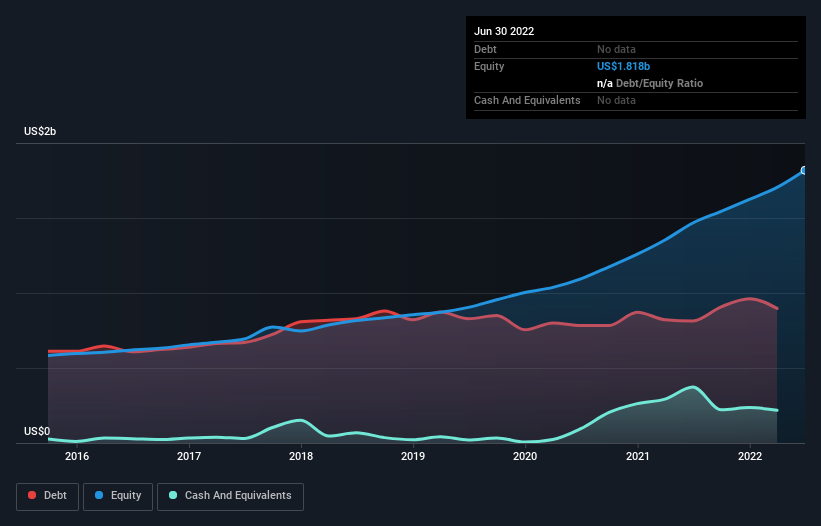
You can click the graphic below for the historical numbers, but it shows that as of June 2022 M/I Homes had US$897.0m of debt, an increase on US$814.1m, over one year. However, it also had US$217.7m in cash, and so its net debt is US$679.3m.
How Healthy Is M/I Homes’ Balance Sheet?
We can see from the most recent balance sheet that M/I Homes had liabilities of US$566.0m falling due within a year, and liabilities of US$1.11b due beyond that. Offsetting this, it had US$217.7m in cash and US$29.1m in receivables that were due within 12 months. So its liabilities outweigh the sum of its cash and (near-term) receivables by US$1.43b.
Given this deficit is actually higher than the company’s market capitalization of US$1.29b, we think shareholders really should watch M/I Homes’s debt levels, like a parent watching their child ride a bike for the first time. In the scenario where the company had to clean up its balance sheet quickly, it seems likely shareholders would suffer extensive dilution.
We measure a company’s debt load relative to its earnings power by looking at its net debt divided by its earnings before interest, tax, depreciation, and amortization (EBITDA) and by calculating how easily its earnings before interest and tax (EBIT) cover its interest expense (interest cover). The advantage of this approach is that we take into account both the absolute quantum of debt (with net debt to EBITDA) and the actual interest expenses associated with that debt (with its interest cover ratio).
M/I Homes has a low debt to EBITDA ratio of only 1.2. And remarkably, despite having net debt, it actually received more in interest over the last twelve months than it had to pay. So it’s fair to say it can handle debt like a hotshot teppanyaki chef handles cooking. Also positive, M/I Homes grew its EBIT by 24% in the last year, and that should make it easier to pay down debt, going forward. The balance sheet is clearly the area to focus on when you are analysing debt. But ultimately the future profitability of the business will decide if M/I Homes can strengthen its balance sheet over time. So if you want to see what the professionals think, you might find this free report on analyst profit forecasts to be interesting.
But our final consideration is also important, because a company cannot pay debt with paper profits; it needs cold hard cash. So it’s worth checking how much of that EBIT is backed by free cash flow. Looking at the most recent three years, M/I Homes recorded free cash flow of 21% of its EBIT, which is weaker than we’d expect. That weak cash conversion makes it more difficult to handle indebtedness.
Our View
While M/I Homes’s level of total liabilities has us nervous. For example, its interest cover and EBIT growth rate give us some confidence in its ability to manage its debt. Looking at all the angles mentioned above, it does seem to us that M/I Homes is a somewhat risky investment as a result of its debt. That’s not necessarily a bad thing, since leverage can boost returns on equity, but it is something to be aware of. The balance sheet is clearly the area to focus on when you are analysing debt. However, not all investment risk resides within the balance sheet – far from it. Be aware that M/I Homes is showing 1 warning sign in our investment analysis , you should know about…
If, after all that, you’re more interested in a fast growing company with a rock-solid balance sheet, then check out our list of net cash growth stocks without delay.
Have feedback on this article? Concerned about the content? Get in touch with us directly. Alternatively, email editorial-team (at) simplywallst.com.
This article by Simply Wall St is general in nature. We provide commentary based on historical data and analyst forecasts only using an unbiased methodology and our articles are not intended to be financial advice. It does not constitute a recommendation to buy or sell any stock, and does not take account of your objectives, or your financial situation. We aim to bring you long-term focused analysis driven by fundamental data. Note that our analysis may not factor in the latest price-sensitive company announcements or qualitative material. Simply Wall St has no position in any stocks mentioned.
[ad_2]
Source link


